


In a downturn, Property Market Values can deviate dramatically from the market “equilibrium” value, a value which can be far lower than market in recessionary times due to strong resistance by the market to dropping values to make the sales. The result can be a large oversupply in the market, with a large part of market weakness observed in rising average times of properties on the market prior to sale as oversupplies mount, and initially relatively mild price or valuations decline as seen in a price/valuations index.
Property values typically adjust very slowly to changes in economic fundamentals.
In the property market in general, there is a strong resistance to price drops to make a sale. This can be due to a number of factors. A property can often be a major investment, and a very important asset on the balance sheet, either for a household or for a business, and as such there is a reluctance to accept that it may not be worth as much as what had been believed for some time. There may be a strong anchoring of value perceptions to recent price levels, or even to the prior purchase value a number of years earlier.
Valuations of properties, whose methodologies rely heavily on existing data related to a property, cannot be expected to move instantly to a sharply lower level when as yet there exists no new historic data on which to base such an adjustment.
Therefore, market values move slowly, and battle to keep up with market reality in a sharp economic shock such as the one that has befallen us since early-2020.
So, when we project negative capital growth for All Commercial Property of -5% in 2020, this is by no means the end of the full weakness story.
When an economic growth shock hits, the downward inflexibility in values forces market values to remain well above the new lower demand-supply equilibrium value initially, and the market becomes oversupplied.
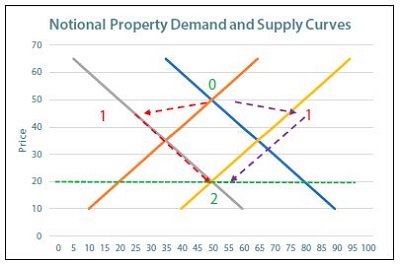
Box 1: Theoretical path of a market value correction in an economic shock in a major economic shock, expect a noticeable move both in demand curve (left) and possibly also the supply curve (right), the latter shifting due to a flood of stressed properties entering the market.
Initial price decline from point 0 to the market disequilibrium point 1 is moderate, often seen only in real terms (due to downward inflexibility in prices/valuations), while disequilibrium build-up is seen in increasing difficulty in selling properties in an oversupplied market, and an increase in average time of properties on the market prior to sale.
Mounting stress, in a deep recession later on can start to cause a more rapid price drop/adjustment to new equilibrium at Point 2.
While equilibrium value/price drops instantly from 50 to 20 the moment the demand and supply curves shift, a market average value of 20 will only be reached far later…or may never be reached should fundamentals recover before the market passes too far past point 1, with demand and supply curves shifting back nearer to D0 and S0 positions timeously.
At this stage, the bulk of market weakness may not yet be witnessed in a drop in a price or valuations index. Rather, it may be seen in a time series showing an increase in the average time of properties on the market prior to being sold….an increasing oversupply of properties sitting for longer and longer as the built in resistance to dropping the prices/valuations holds.
Very often, during and after a sharp economic and property market downturn, the market values never actually drop as far as the recession period’s lower “required” market equilibrium value (the value at which demand would be sufficient to clear oversupplies). Instead, the economy recovers before prices/values complete the downward adjustment, property demand starts to recover, and declining market values meet a rising/recovering market equilibrium value somewhere in between.
During a sharp economic and market downturn, it is often said that “this is the value of the property, but the market is dead and nothing is selling”. It is at such times that market valuations reflect a market in demand-supply “disequilibrium”, and it can remain there for lengthy periods of time.
2019 had already seen signs of a disequilibrium situation emerging.
Indeed, we had already witnessed a disequilibrium position emerging in the Commercial Property Market through 2019 to early-2020, if the FNB Property Broker Survey is anything to go by, and the trend is likely to be accelerated in 2020 by the deep economic shock currently unfolding.
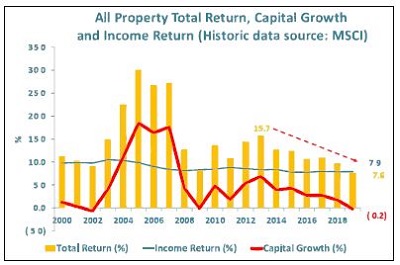
The MSCI annual property data set had shown average capital growth slowing over a number of years, before finally moving into slight negative territory in 2019, to the tune of -0.2% (already significantly more negative in real inflation-adjusted terms).
At the same time, the FNB Commercial Property Broker Survey has effectively been suggesting that slowing average value growth and capital growth of recent years has not been sufficient enough to keep the in a demand-supply equilibrium position.
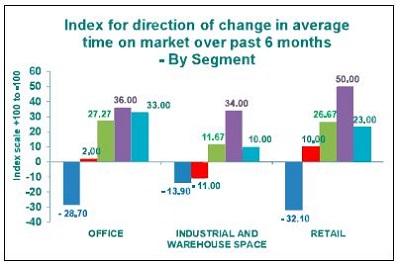
The brokers on average point to a rising average time of properties on the market. In the survey we ask them to indicate whether the average time of commercial properties on the market has “lengthened”, “remained the same” or “declined” over the 6 months prior to the survey, assigning a value of +1, zero and -1 to the respective responses.
We then compile an “Index for direction of change in average time of properties on the market over the past 6 months”. Should this index have a reading above zero, it would mean that more respondents perceive a rise in average time on market over the past 6 months than those perceiving a decline, and vice versa for a negative value.
Over the past 3 quarterly surveys, all 3 major property sectors, ie. Industrial, Office and Retail have returned a positive reading, pointing to an aggregated perception of a weakening demand-supply balance and resultant rising average time of properties on the market.
In a follow up question, we request an indication of whether supply exceeds demand or vice versa. In all 3 sectors in the 1st quarter 2020 survey we saw a bias in favour of supply exceeding demand.
CONCLUSION
In short, during a sharp economic and resultant property market weakening, due to the slow pace at which property values adjust downwards, demand and supply typically move away from equilibrium, with market values/prices well above the equilibrium value. The unbalanced market can remain like this for long periods of time, adjusting gradually, and property price or valuations indices won’t reflect the full extent of the market weakness.
It is in such times that sellers under financial pressure, looking to sell properties quickly, can often be required to do so at well-below “market value” (a disequilibrium value at which very few properties sell), because they are required to go significantly lower towards “market equilibrium value” in order to find the demand that they require.
Courtesy: The EAAB - Estate Agency Affairs Board


© 2005 - 2026 | Portfolio Property Investments | Powered by the PPI Business Platform