


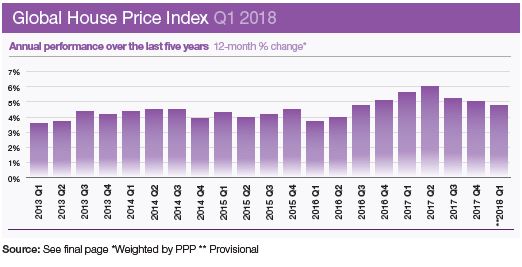
Results for Q1 2018
HONG KONG BACK ON TOP OF PRICE RANKINGS
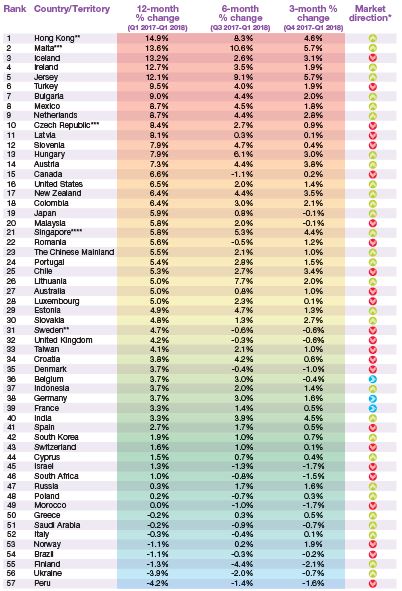
The latest results show Hong Kong holds the top spot once more, Europe’s rally continues and globally, the outliers are diminishing as property price performance converges.
Hong Kong leads our Global House Price Index rankings for the first time since the second quarter of 2015 with average prices ending the 12 months to March, 14.9% higher. Since our index was first published in 2008, Hong Kong has held the top spot on ten different occasions – more than any other territory tracked.
Despite an improving supply scenario over the long-term – 96,000 apartments are due to be released in the next three to four years – and the likelihood of a prime rate rise, prices in Hong Kong continue to accelerate with small to medium-sized units recording the strongest price growth.
The Mediterranean island of Malta occupies second spot (13.6%) in our rankings, while Iceland (13.2%), Ireland (12.7%) and Jersey (12.1%) complete the top five.
Supply constraints alongside strengthening demand are together putting pressure on prices in both Malta and Jersey.
In Ireland’s case, its burgeoning economy explains its strong performance. Ireland has been Europe’s fastest-growing economy for four consecutive years, with GDP growth estimated to have reached 7.8% in 2017. Despite rising by 12.7% in the year to March, residential prices in Ireland remain 21% below their peak in Q1 2007.
As we indicated in our last edition, Europe’s recovery is now well-underway, closer analysis confirms 11 of the 15 strongest-performing housing markets globally were in Europe at the end of March 2018.
But it’s not a uniform picture; Greece (-0.2%), Italy (-0.3%), Norway (-1.1%) and Finland (-1.3%) all sit within the bottom ten rankings.
What is clear is the extent to which the outliers are disappearing with the performance of countries and territories now converging. A year ago 18% of markets recorded annual price growth above 10%, in Q1 2018 this figure has fallen to 9% (figure 3). This may be an indication that buyer sentiment is weakening, as the shift towards tighter monetary policy and the removal of stimulus becomes a reality in key global economies.
Ahead of the G7 summit, we assess average price change for each member state and the rise in base points since the last G7 summit a year ago (figure 4). Canada and the US, the two markets that have registered the strongest rise in prices, have also seen their base rate rise by 0.75 basis points over this time.
Analysis by world region shows North America (6.6%) remains on top (based on a simple non-weighted average), second is Asia Pacific (5.7%) but now hot on its heels is Europe (5.3%) with the Middle East (3.5%), Latin America (3%), Africa (0.5%) also recording positive growth, only Russia and the CIS (-1.8%) saw prices decline on a regional basis.
Knight Frank Global House Price Index Q1 2018
Source: Knight Frank Research
*Direction of annual price growth compared to previous quarter
** Provisional ***Asking prices **** Island-wide price index for non-landed properties
Data for Australia, Belgium, Cyprus, Czech Republic, Denmark, Estonia, Finland, France, Germany, Greece, India, Israel, Italy, Japan, Latvia, Malaysia, Morocco, New Zealand, Peru, Poland, Romania is to Q4 2017; data for Bulgaria, Croatia, Hungary, Luxembourg and Slovenia is to Q3 2017.
Courtesy: Knight Frank

DATA DIGEST
The Knight Frank Global House Price Index established in 2006 allows investors and developers to monitor and compare the performance of mainstream residential markets around the world. The index is compiled on a quarterly basis using official government statistics or central bank data where available. The index’s overall performance is weighted by GDP on a Purchasing Power Parity basis and the latest quarter’s data is provisional pending the release of all the countries’ results.
Sources: Knight Frank Research; Macrobond, Bank for International Settlements; Eurostat; Australian Bureau of Statistics; OeNB; Statbel; FIPE; Bulgarian National Statistical Institute; Teranet in alliance with National Bank of Canada; Chilean Chamber of Construction; China National Bureau of Statistics (NBS); DANE; Croatian Bureau of Statistics; Central Bank of Cyprus; Czech Statistics Office; Statistics Denmark; Statistics Estonia; Statistics Finland; INSEE; Federal Statistical Office of Germany; Bank of Greece; Hong Kong Rating & Valuation Department; Hungarian Central Statistical Office; Statistics Iceland; India National Housing Bank; Bank of Indonesia; Irish Department of Environment, Heritage and Local Government; Israel Central Bureau of Statistics; Italian National Institute of Statistics; Japan’s Ministry of Land, Infrastructure, Transport and Tourism; States of Jersey Statistics Unit; Central Statistics Latvia; Lithuania State Enterprise Centre of Registers; STATEC; Malaysian Valuation & Property Services Department; Central Bank of Malta; Mexican Federal Mortgage Company (SHF Sociedad Hipotecaria Federal); Central Bank of Morocco; Statistics Netherlands; Quotable Value LTD and Reserve Bank of New Zealand; Statistics Norway; Central Reserve Bank of Peru; Polish Central Statistical Office (GUS); Portuguese National Statistics Institute (INE); Romanian Statistics Office; Rosstat; Saudi Arabian Central Department of Statistics & Information (CDSI); Singapore Urban Redevelopment Authority (URA); National Bank of Slovakia; Slovenian Statistical Office; First National Bank; Government of South Korea; Spanish Ministry of Development; Statistics Sweden; Swiss National Bank/Wuest & Partner; Taiwan Ministry of the Interior; Central Bank of the Republic of Turkey (TCMB); Blagovest; HM Land Registry; S&P Case Shiller
RESIDENTIAL RESEARCH
Liam Bailey - Global Head of Research
+44 20 7861 5133
Kate Everett-Allen - International Residential Research
+44 20 7167 2497
PRESS OFFICE
Astrid Recaldin
+44 20 7861 1182
Important Notice
© Knight Frank LLP 2018 – This report is published for general information only and not to be relied upon in any way. Although high standards have been used in the preparation of the information, analysis, views and projections presented in this report, no responsibility or liability whatsoever can be accepted by Knight Frank LLP for any loss or damage resultant from any use of, reliance on or reference to the contents of this document. As a general report, this material does not necessarily represent the view of Knight Frank LLP in relation to particular properties or projects. Reproduction of this report in whole or in part is not allowed without prior written approval of Knight Frank LLP to the form and content within which it appears. Knight Frank LLP is a limited liability partnership registered in England with registered number OC305934. Our registered office is 55 Baker Street, London, W1U 8AN, where you may look at a list of members' names

© 2005 - 2026 | Portfolio Property Investments | Powered by the PPI Business Platform