


GLOBAL HOUSE PRICE GROWTH WEAKENS
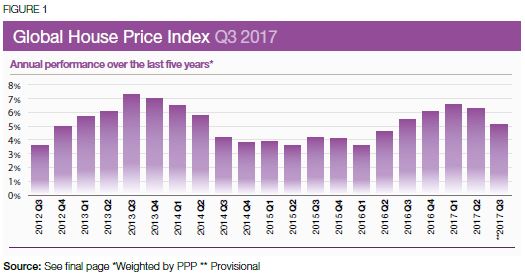
The main story from this quarter’s data is of slowing growth. Overall, the index increased by 5.1% year-on-year compared with 6.3% last quarter. This represents the index’s lowest rate of annual growth since the start of 2016.
Results for Q3 2017
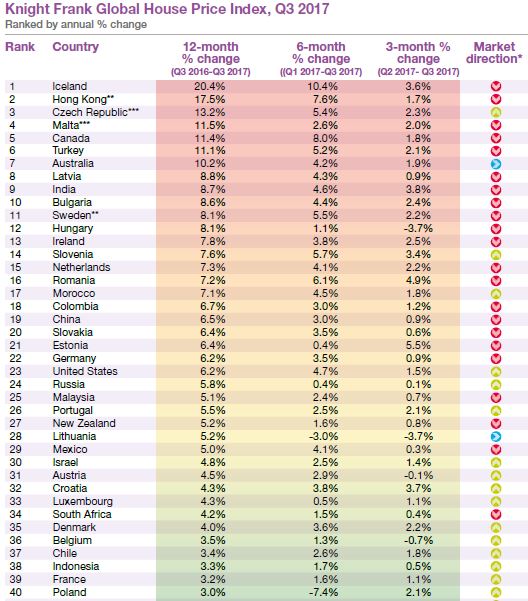
Although nearly nine in every ten of the countries tracked by our index recorded positive annual price growth in the year to September 2017, almost half saw their rate of annual growth decline compared with the previous quarter.
The shift was most evident at the top of the rankings table. Thirteen of the 15 strongestperforming housing markets around the world registered a slowdown in their rate of annual growth in the year to September.
Iceland leads our annual rankings with average prices ending the year to September 20.4% higher, down from 23.2% last quarter. Iceland has now topped our annual rankings for four consecutive quarters.
Hong Kong has clung on to second place but data from the Hong Kong Ratings and Valuation Department shows price growth equated to only 1.7% in the three months to September.
Estonia, Hungary and New Zealand have dropped out of the top ten this quarter. New Zealand slipped from 10th place to 27th as annualised price growth declined from 10.4% to 5.2%. Tighter lending conditions and plans to introduce a ban on foreign investors in 2018 have potentially reduced some of the speculative activity in the market.
This quarter marks the inclusion of Saudi Arabia within the index for the first time. Latest data shows prices slipped 5.4% on an annual basis meaning it is second only to Ukraine as the weakest-performing market. The oil-dependent Saudi economy is struggling to gain traction, which along with the recent introduction of a levy on expatriate workers is stifling housing demand.
The US and the UK are following different trajectories, mirroring their economic performance. Average prices in the US accelerated 6.2% over the 12-month period, up from 5.8% last quarter whilst the UK has incurred a marginal dip from 2.8% to 2.6%. The UK market remains highly localised with affordability a key concern in many markets.
China has slipped from 12th to 19th position in our rankings. House prices are now rising at their slowest rate for five quarters, up by 6.5% on an annual basis according to the National Bureau of Statistics.
European housing markets are firmly back in the spotlight. On average, the region recorded 5.6% annual price growth in the year to September, up from 2.3% three years ago. The good news for Europe doesn’t end there. Greece (0.7%) may finally see price growth reach positive territory over the next quarter after nine years of negative annual growth.
Despite Europe’s recent recovery, analysis over a five and 10-year period underlines the extent to which countries within Asia Pacific still rank amongst the highest performers.
Source: Knight Frank Research
*Direction of annual price growth compared to previous quarter
** Provisional ***Asking prices **** Island-wide price index for non-landed properties
Data for Australia, Belgium, Bulgaria, Colombia, Croatia, Cyprus, Czech Republic, Denmark, Finland, France, Hungary, India, Israel, Italy, Lithuania, Luxembourg, New Zealand, Romania and Slovakia is to Q2 2017; data for Morocco is to Q1 2017.
Courtesy: Knight Frank

DATA DIGEST
The Knight Frank Global House Price Index established in 2006 allows investors and developers to monitor and compare the performance of mainstream residential markets around the world. The index is compiled on a quarterly basis using official government statistics or central bank data where available. The index’s overall performance is weighted by GDP on a Purchasing Power Parity basis and the latest quarter’s data is provisional pending the release of all the countries’ results. Source: Knight Frank Research; Australian Bureau of Statistics; OeNB, Prof. Wolfgang Feilmayr, Department of Spatial Planning, Vienna University of Technology; Statistics Belgium; FIPE; Republic of Bulgaria National Statistical Institute; Teranet-National Bank House Price Index™. Reproduced and distributed on an “as is” basis with the permission of Teranet Inc. and National Bank of Canada; China Statistical Information Network www.stats.gov.cn; Banco de la Republica – Colombia; Croatian Bureau of Statistics; Central Bank of Cyprus; Czech Statistical Office; Own calculations based on data from Statistics Denmark; Statistics Estonia; Statistics Finland; INSEE; Europace; Bank of Greece; Hong Kong Ratings and Valuation Department; FHB; Statistics Iceland; Reserve Bank of India NHB Residex; Bank Indonesia; Ireland Central Statistic Office; Israel Central Bureau of Statistics; Nomisma; Japan Real Estate Institute; States of Jersey; Lithuania Centre of Registers; Luxembourg Ministiere du Logemont; NAPIC Indonesia; Central Bank of Malta; Government of Mexico; Central Bank of Morocco www.bkam.ma; CBS Statistics Netherlands; Quotable Value; CoreLogic NZ Ltd; Statistics Norway; Central Statistical Office of Poland; Romania National Institute of Statistics; Rosstat; Saudi Arabian General Authority for Statistics; Singapore Urban Redevelopment Authority; National Bank of Slovenia; First National Bank; Kookmin Bank; Spanish Ministry of Development; Statistics Sweden; Swiss National Bank/Wüest Partner AG; Central Bank of the Republic of Turkey; Blagovest Real Estate Agency of Ukraine; Nationwide; S&P Case Shiller CoreLogic
RESIDENTIAL RESEARCH
Liam Bailey - Global Head of Research
+44 20 7861 5133
Kate Everett-Allen - International Residential Research
+44 20 7167 2497
PRESS OFFICE
Astrid Recaldin
+44 20 7861 1182
Important Notice
© Knight Frank LLP 2017 – This report is published for general information only and not to be relied upon in any way. Although high standards have been used in the preparation of the information, analysis, views and projections presented in this report, no responsibility or liability whatsoever can be accepted by Knight Frank LLP for any loss or damage resultant from any use of, reliance on or reference to the contents of this document. As a general report, this material does not necessarily represent the view of Knight Frank LLP in relation to particular properties or projects. Reproduction of this report in whole or in part is not allowed without prior written approval of Knight Frank LLP to the form and content within which it appears. Knight Frank LLP is a limited liability partnership registered in England with registered number OC305934. Our registered office is 55 Baker Street, London, W1U 8AN, where you may look at a list of members’ names.

© 2005 - 2026 | Portfolio Property Investments | Powered by the PPI Business Platform