


Results for Q1 2017
GLOBAL HOUSE PRICE INDEX GAINS MOMENTUM
A year ago “slow and steady” was the order of the day with the narrative surrounding global house prices one of convergence. Our latest round-up however shows the outliers are returning.
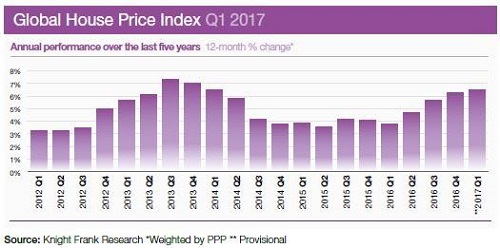
Average house prices rose by 6.5% on average* across the 55 countries tracked by our index, the highest rate of annual growth recorded by the index since the first quarter of 2014.
It is not simply that more countries are recording positive growth although that has played a part – 43 countries recorded price rises in Q1 2016, a year on and this figure has risen to 48. This rise has been accompanied by a concomitant increase in the number of countries seeing double digit annual growth rates. Eleven countries recorded double-digit price growth in the year to March 2017, a year earlier only four fell into this bracket.
Given the uncertain global political landscape, the ramping up of cooling measures in large parts of Asia and the unravelling of stimulus measures such as QE in some parts of the world why are average prices shifting up a gear? Economic growth is one reason – the IMF forecast global GDP to rise by 3.5% in 2017 up from 3.1% in 2016 – property’s reputation as a safe haven investment is another, along with the greater availability of mortgage finance in developing markets.
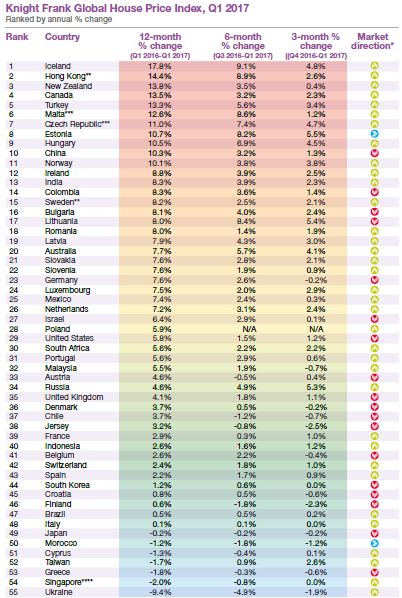
Iceland, which leads the rankings for the second consecutive quarter, is heating up with average house prices rising by 17.8% year-on-year. A dearth of new supply is
behind the accelerating prices. Iceland’s Housing Financing Fund suggests 9,000 new apartments need to be delivered over the next three years in Reykjavik alone to keep pace with demand.
Although China has slipped from seventh to tenth in our annual rankings this equates to a marginal fall from 10.8% last quarter to 10.3% this quarter. Despite various property market cooling measures, including home purchase restrictions (HPR) and increased downpayment ratios, residential prices continued to rise. The Central Government has widened HPR and as of April 2017, more than 45 cities have implemented such measures.
Europe’s top performers are an eclectic mix; Malta (12.6%), Czech Republic (11%), Estonia (10.7%) and Hungary (10.5%). Economic expansion and the Individual Investor Programme (IIP) explain Malta’s rise, whilst historically low interest rates, wage increases and rising foreign interest are strengthening demand in the remaining three.
As the UK prepares for its fourth national poll in seven years, data suggests property prices continue to ease with annual growth reaching 4.1% in the year to March, down from 5.3% a year earlier. A brief look at some of the key elections in 2017 shows France and the Netherlands stand out as two key countries where price growth strengthened ahead of their polls.
Source: Knight Frank Research
*Direction of annual price growth compared to previous quarter
** Provisional ***Asking prices **** Island-wide price index for non-landed properties
Data for Australia, Austria, Belgium, Bulgaria, Colombia, Croatia, Czech Republic, Denmark, Finland, Hungary, India, Israel, Italy, Lithuania, Malaysia, Malta, New Zealand, Romania and Slovenia to Q4 2016; data for Cyprus, Luxembourgh and South Africa to Q3 2016 and data for Chile and Morocco is to Q2 2016
Courtesy: Knight Frank

DATA DIGEST
The Knight Frank Global House Price Index established in 2006 allows investors and developers to monitor and compare the performance of mainstream residential markets around the world. The index is compiled on a quarterly basis using official government statistics or central bank data where available. The index’s overall performance is weighted by GDP on a Purchasing Power Parity basis and the latest quarter’s data is provisional pending the release of all the countries’ results.
RESIDENTIAL RESEARCH
Liam Bailey - Global Head of Research
+44 20 7861 5133
Kate Everett-Allen - International Residential Research
+44 20 7167 2497
PRESS OFFICE
Astrid Etchells
+44 20 7861 1182
Important Notice
© Knight Frank LLP 2017 – This report is published for general information only and not to be relied upon in any way. Although high standards have been used in the preparation of the information, analysis, views and projections presented in this report, no responsibility or liability whatsoever can be accepted by Knight Frank LLP for any loss or damage resultant from any use of, reliance on or reference to the contents of this document. As a general report, this material does not necessarily represent the view of Knight Frank LLP in relation to particular properties or projects. Reproduction of this report in whole or in part is not allowed without prior written approval of Knight Frank LLP to the form and content within which it appears. Knight Frank LLP is a limited liability partnership registered in England with registered number OC305934. Our registered office is 55 Baker Street, London, W1U 8AN, where you may look at a list of members’ names.

© 2005 - 2026 | Portfolio Property Investments | Powered by the PPI Business Platform