


Commercial Sector Q1 | 2017
Special Issue by Guest Writer John Loos, FNB Property Strategist
Is it time for commercial tenant payment performance to get a little worse before it gets better?
The Economy- weak but strengthening? ...Difficult to gauge
At present, it is tough to gauge the direction of the South African economy, which has a strong influence on the rental payment performance of commercial property tenants. Certain leading business cycle indicators, notably the SARB (South African Reserve Bank) Composite Leading Business Cycle Indicator, was rising steadily up until its March data point, suggesting improving economic times to come in the near term after a lengthy period of stagnation. Such an improvement is plausible, given the alleviation of drought conditions in many parts of the country, which is positive for Agriculture, and given some moderate improvement in global metals prices, which is good for the Mining part of the economy. Strengthening of those sectors of the economy can filter through to the rest of the economy over time.
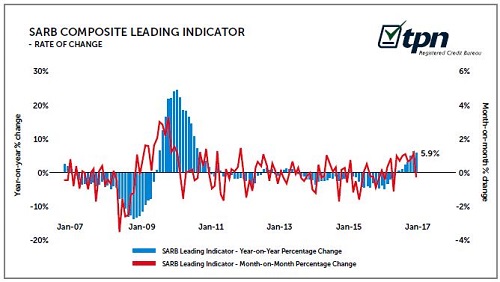
However, we now wait to see how things may have changed due to the recently widely publicised ratings downgrades by global ratings agencies. This can possibly dampen sentiment. In more up to date releases for April, we have seen drops in both the Barclays Manufacturing Purchasing Managers Index (PMI) as well as the Standard Bank Purchasing Managers Index which is a broader PMI measure extending into the services sectors of the economy too.
But April can be a funny month with its myriad of public holidays, so it is too early to tell whether there is a direction change looming.
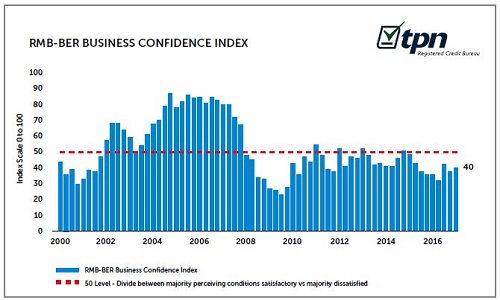
What we do know, however, is that Business Confidence remained in the doldrums in the 1st quarter, with the RMB-BER Business Confidence Index at a level of 40 (on a scale of 0 to 100), indicating that even despite the index being off its worst multi-year levels, still 60% of survey respondents were dissatisfied with business conditions).
Is there a lagged impact of economic weakness still to come for commercial tenant performance?
What is also possible, is that even should the economy improve mildly in the near term, there could still be a lagged negative impact on commercial tenant performance to come, after 5 years of broad economic stagnation from 2012 to 2016. In other words, tenant performance could get a little worse before it gets better.
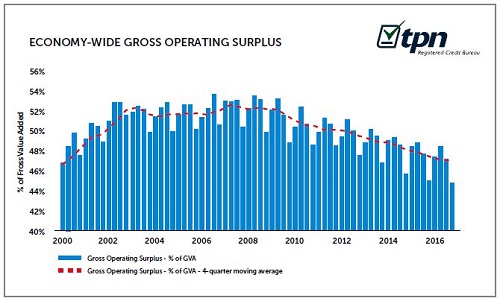
This economic growth stagnation of recent years, along with a domestic wage bill whose growth outstripped economic growth due to significant wage inflation, has exerted pressure on the economy-wide Gross Operating Surplus (GOS)
Eurostat defines GOS as follows: “Gross operating surplus can be defined in the context of national accounts as a balancing item in the generation of income account representing the excess amount of money generated by incorporated enterprises' operating activities after paying labour input costs. In other words, it is the capital available to financial and non-financial corporations which allows them to repay their creditors, to pay taxes and eventually to finance all or part of their investment.”
The multi-year decline in the economy-wide GOS from near 53% in 2007 to 47% by 2016 implies a squeeze on the Commercial Sector’s resources with which it pays the various non-labour costs.
So how is tenant payment performance at present?
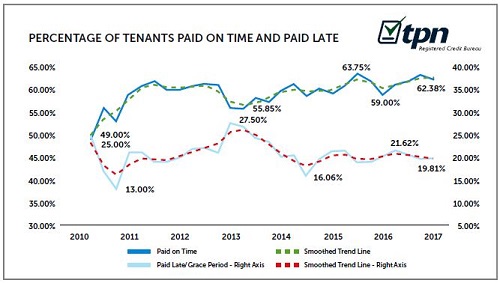
But are there any signs of deteriorating commercial tenant payment performance yet? Not a lot. Actually, the payment situation still appears quite solid. In the 1st quarter of 2017, the percentage of commercial tenants “in good standing” with their landlord was 82.27%. This is slightly below the previous quarter’s 83.11%, and slightly lower than the 7-year high of 83.56% reached in the 3rd quarter of 2012.
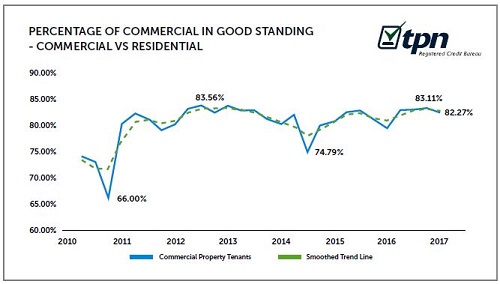
However, this percentage remains a strong one when compared to the post-2008/9 recession low of 66% reached late in 2010.
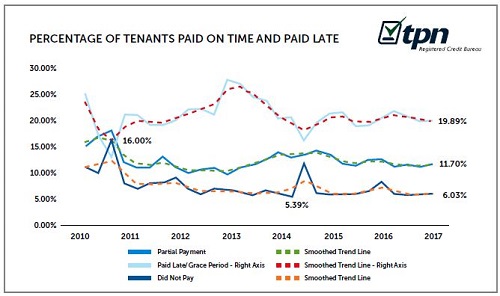
Breaking down the tenants “in good standing” percentage, we see 62.38% paid on time, while 19.81% paid late (including those who were given a grace period).
The percentage of tenants that did not pay was off its multi-year best of 5.39% reached at a stage of 2014, but at a marginally higher 6.03% in the 1st quarter of 2017 the percentage remained low compared to the post-2008/9 recession high of 16% reached late in 2010.
Does residential tenant payment performance provide a leading indication of commercial tenant trends to come?
Examining the percentage of commercial tenants in good standing in conjunction with the percentage of residential tenants in good standing, however, we believe that the residential group of tenants may lead the commercial tenants’ trend by a considerable period, and may recently have been pointing the way towards mild deterioration in payment performance to come. Admittedly, the data history of payment performance for both tenant groups is relatively short. But going by what we have so far, the shape of the residential tenant “in good standing” graph appears very similar to that of commercial tenants, but with the peaks and troughs in movements in residential performance leading the peaks and troughs of commercial tenant performance by a considerable 7 to 13 quarters.
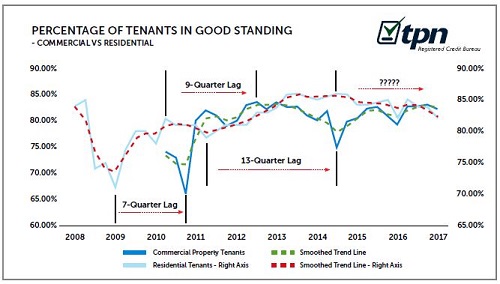
This suggests that residential tenants are far more sensitive, and respond far quicker, to both positive and negative economic changes than do commercial tenants.
The percentage of residential tenants in good standing began a very mild weakening from late in 2014, from a multi-year high of 85.7% to 82.27% by the 1st quarter of 2017, both interest rate hiking and economic weakness likely to have played a role.
Over 2 years on, it would appear time to see some mild deterioration in commercial tenant performance, after this sector has absorbed various pressures for a considerable time.
The good news is that the residential tenant performance deterioration has been mild to date, to levels which can still be described as “healthy,” perhaps suggesting that any possible commercial tenant weakness could be mild too.
What has kept tenant performance relatively solid to date in this time of economic stagnation and interest rate hikes?
Key to only a mild deterioration in tenant performance to date was probably the very slow pace of economic deterioration from 2012 to 2016, which is probably best described as a “slow puncture”.
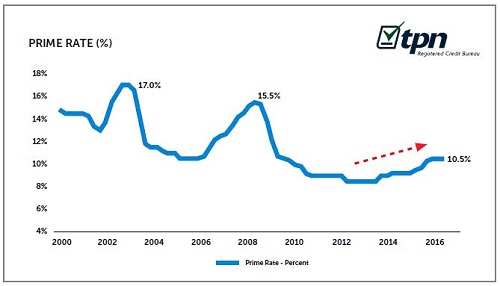
Key to the slow pace of cyclical weakening has been the SARB’s “snail’s pace” of interest rate hiking, by only 2 percentage points over slightly more than 2 years from early-2014 to early-2016.
The Commercial Sector has, in many instances therefore had time to adjust and absorb mounting financial pressure. But not everyone can do this indefinitely, and we think it likely that mild near term tenant performance deterioration could follow first before it gets better.
Major Provinces Tenant Performance
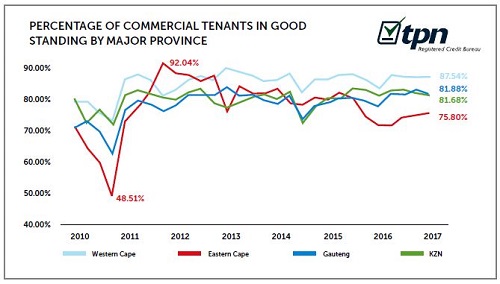
All 4 major provinces (Gauteng, KZN, Western Cape and Eastern Cape) are off their multi-year highs in terms of the percentage of commercial tenants in good standing as at the 1st quarter of 2017.
The Western Cape, perhaps not surprisingly, had the highest percentage of commercial tenants in good standing, to the tune of 87.54%.
We say “not surprisingly” because that province has likely had the strongest economic growth rate of the major provinces in recent times, if its outperforming housing market and anecdotal evidence of relatively positive sentiment in that region is any reflection of its economic performance.
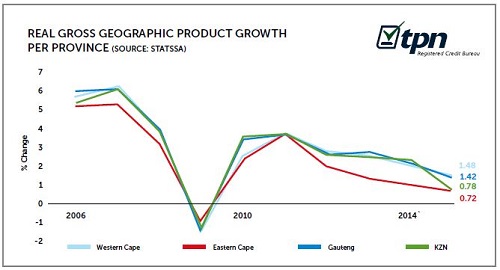
We don’t have 2016 provincial economic growth data yet, but the Western Cape had by a small margin the strongest estimated real economic growth rate of 1.48% in 2015.
Gauteng had the 2nd highest commercial tenants in good standing percentage, i.e. 81.88%, now narrowly ahead of KZN’s 81.68%.
But the Eastern Cape’s tenant performance recently smacks of weak economic performance. This province has seen its “in good standing” percentage decline the most since 2011, from a high of 92.04% at a stage of that year to a lowly 75.8% by the 1st quarter of 2017.
This possibly ties in with the Eastern Cape’s estimated economic growth rates of recent years. The province has averaged only 1.8% GDP growth per annum from 2011 to 2015, compared to KZN’s 2.4%, Western Cape’s 2.5% and Gauteng’s 2.6%.
Tenant performance by rental value band
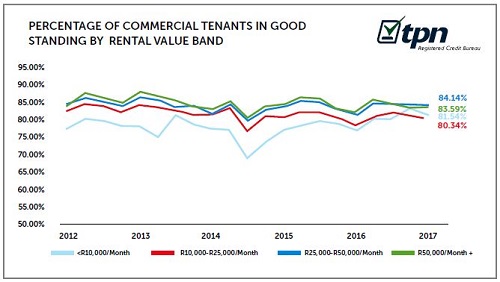
The more affordable “Less than R10,000/month” rental category appears to have been more resilient in tougher economic times, having shown a significant improvement from a lowly 68.76% of tenants being in good standing in the 3rd quarter of 2014 to 81.54% by the 1st quarter of 2017. After this major improvement, this category is no longer the one with the weakest payment performance. That dubious honour goes to the R10,000 - R25,000/month rental category at 80.34% of tenants in good standing.
Courtesy: TPN - Tenant Profile Network

Published by TPN Credit Bureau
ACS House, 370 Rivonia Boulevard, Rivonia 2128, South Africa
Website: www.tpn.co.za

© 2005 - 2026 | Portfolio Property Investments | Powered by the PPI Business Platform