


June 2014 House Price Index growth rate unchanged from previous month, but has gradually slowed since January
JUNE 2014 HOUSE PRICE INDEX FINDINGS
While the solid performance of the housing market continues, average price growth remains off levels seen early in 2014.
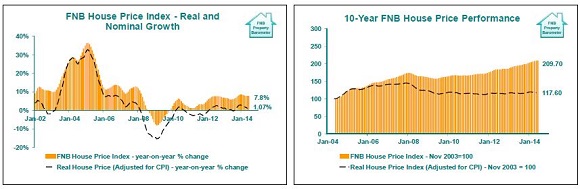
According to the FNB House Price Index, the average house price for June 2014 rose 7.8 year-on-year. This is unchanged from the previous month’s revised 7.8%, and mildly slower than the 8.5% growth recorded at the start of 2014.
Real house price growth (i.e. when house prices are adjusted for consumer price inflation), came in at 1.07% year-on-year in May (June CPI not yet available). This represents a slight slowing from a revised 1.58% real price growth in April, due in part to the pace of CPI inflation having quickened slightly further in April, from 6.1% in April to 6.6% in May.
The average price of homes transacted was R960,570.
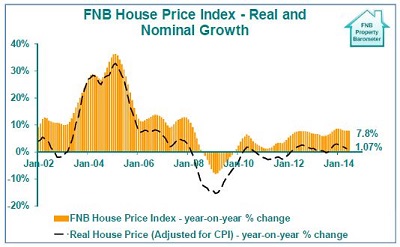
In real terms, the FNB House Price Index for May was -18.9% down on December 2007, the month in which the boom time peak in real house prices was reached. In nominal terms, house prices by June 2014 were 21.3% higher than December 2007.
HAVE FNB’S VALUERS HAVE EXPERIENCED MARKET IMPROVEMENT RECENTLY, BUT THE PACE OF IMPROVEMENT HAS SLOWED.
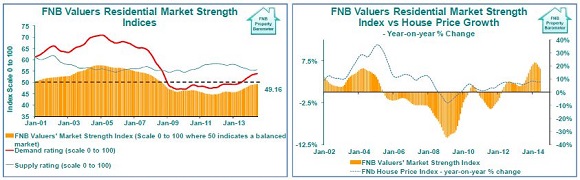
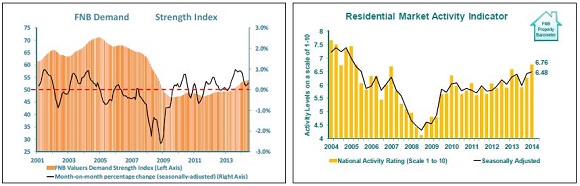
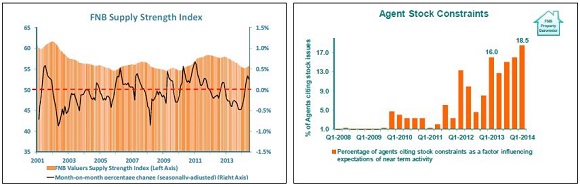
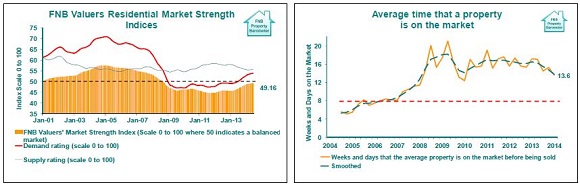
While the available residential market indicators still point to a well-balanced market, the FNB Valuers’ Market Strength Index (Explanatory notes on page 5) has since early in 2014 suggested that the pace of improvement in market strength has slowed. This may be reflective of 2 factors, i.e. an economic contraction in the 1st quarter of 2014 as well as the 1st interest rate hike since mid-2008 by the SARB (Reserve Bank).
From a revised level of 49.1 in May, the FNB Valuers’ Market Strength Index rose slightly to 49.16 in June. This rise is the result of a rise in the Valuers’ Demand Rating, which was accompanied by a lesser rise in the Valuers’ Supply Rating.
However, the year-on-year growth rate in the Valuers’ Market Strength Rating slowed for the 4th successive month after peaking in February.
In other words, while the FNB Valuers still point towards a healthy market balance, they have suggested that the pace of market strength improvements have slowed in recent months, which should not have been altogether surprising given the recent economic environment.
CONCLUSION – 2012-EARLY-2014 HAS BEEN GOOD, BUT THE PACE OF THE 2ND PERIOD OF POSTRECESSION MARKET IMPROVEMENT MAY BE SLOWLY TAPERING OFF
At present, the FNB house price and Valuers’ Market Strength data still points to market improvement. However, gradually slowing nominal and real house price growth, as well as tapering year-on-year increase in the Market Strength Index, just suggest that the 2nd period of noticeable residential market strengthening may now be tapering off as economic and interest rate stimulus fades. The 1st significant residential market strengthening following the 2008/9 recession came around late-2009 and 2010 after a prior period of house price and sharp activity decline.
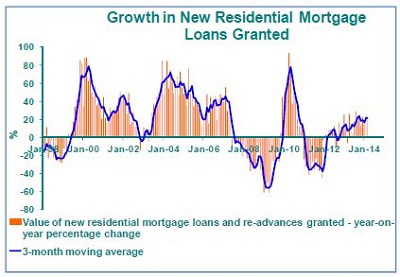
Then we went into the “2nd leg of the “Double Dip”, but while some of us had feared another extreme magnitude of slump in the economy and housing market, the massive global and domestic monetary and fiscal stimulus had caused this 2nd Dip to be a mild one in 2011. The 2nd period of noticeable recovery then took place from early-2012 and through 2013. During this time, house price growth has strengthened markedly, which reflects growing supply constraints caused by steadily rising residential transaction volumes along with solid growth in the value of new mortgage loans granted and paid out. For the 1st 3 months of 2014, the Reserve Bank (SARB) reported 21.4% year-on-year growth in the value of new residential mortgage loans granted.
![]()
The 2nd “resurgence” in the residential market has also been seen in growth in the value of transfer duty revenue. This has been the effect of the combination of rising property transaction volumes, improved property price inflation since early-2012, and transfer duty bracket creep as certain properties inflate into higher transfer duty brackets.
While transfer duty data includes commercial property transfer duty revenue, the residential market is a very strong contributor. However, while still showing strong growth at 20.19% year-on-year, this growth rate has not progressed higher for some time, having been gradually forming a growth peak since back in 2013.
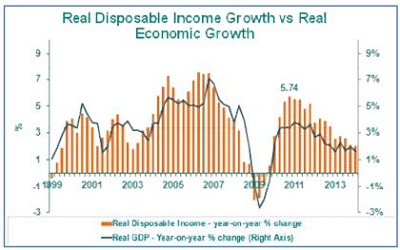
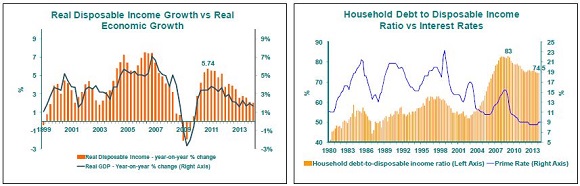
But what leads us to believe that the pace of strengthening in the housing market, as well as house price inflation, probably has to taper further is a look at residential-related economic fundamentals. By the 1st quarter of 2014, real household disposable income growth had slowed to a year-on-year rate of 2%, following a steady slowing trend from 5.7% as at the end of 2010, constrained by a troubled economy and a multi-year slowdown in economic growth since 2011.
And then, due to a January interest rate hike by the SARB (Reserve Bank), we started to see a slight rise in the Household Sector Debt-Service Ratio (Household Sector interest on debt expressed as a percentage of disposable income), from 7.7% of disposable income at the end of 2013 to 7.9% in the 1st quarter of 2014.
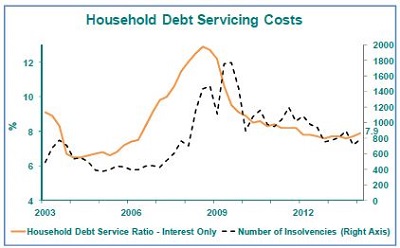
Further increase in the Debt-Service Ratio is anticipated as interest rates rise gradually further. Our expectation is for Prime rate to rise moderately to 10.25% by the end of next year. While this is certainly not at all extreme interest rate hiking, a rise in the Debt Service Ratio even of small in magnitude is expected to be mildly more growth constraining on the highly credit-driven residential market, given that the recovery in the market since 2009 has been in part driven by a declining Debt Service Ratio up until last year.
Other monthly indicators also point to a lack of further improvement in the Household Economy, notably insolvencies numbers, which no longer show any meaningful decline, while the SARB Leading Business Cycle Indicator’s recent monthly year-on-year declines support the expectation of a weak economy in the near term.
With the global economy having done significantly better in recent times, South Africa’s economic growth could conceivably see improvement towards 2015. But much will depend on our ability to resolve some key labour relations issues, and to significantly slow the level of disruption caused by strike action.
In the mean time, we continue to believe that the most likely scenario will be one of further gradual tapering in house price growth, to nearer to 6% by year end, as growth in residential demand is curtailed by slow disposable income growth and slowly rising interest rates.
THE PROPERTY ECONOMY IN PICTURES
Household Sector Debt and Disposable Income Growth
Housing Demand and Activity Levels
Housing Supply
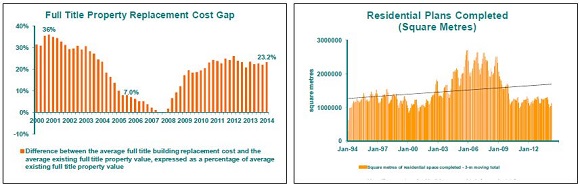
New Home Supply
Housing Market Demand-Supply Balance
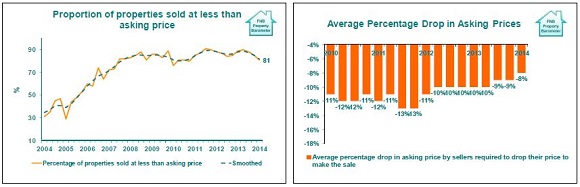
Housing Market Price Realism
Housing Price Performance
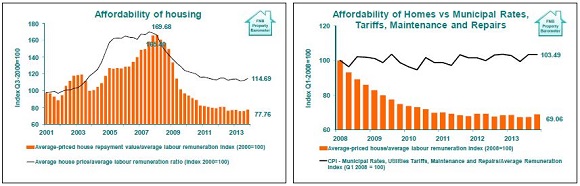
Housing Affordability
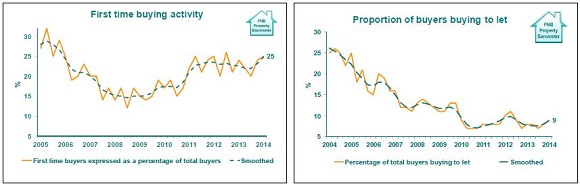
1st Time and Buy-to-Let Buying
ADDENDUM - NOTES:
Note on The FNB Average House Price Index: Although also working on the average price principle (as opposed to median or repeat sales), the FNB House Price Index differs from a simple average house price index in that it could probably be termed a “fixed weight” average house price index.
One of the practical problems we have found with house price indices is that relative short term activity shifts up and down the price ladder can lead to an average or median price index rising or declining where there was not necessarily “genuine” capital growth on homes. For example, if “suburban segment volumes remain unchanged from one month to the next, but former Black Township (the cheapest areas on average) transaction volumes hypothetically double, the overall national average price could conceivably decline due to this relative activity shift.
This challenge of activity shifts between segments is faced by all constructors of house price indices. In an attempt to reduce this effect, we decided to fix the weightings of the FNB House Price Index’s sub-segments in the overall national index. This, at best, can only be a partial solution, as activity shifts can still take place between smaller segments within the sub-segments. However, it does improve the situation.
With our 2013 re-weighting exercise, we have begun to segment not only according to room number, but also to segment according to building size within the normal segments by room number, in order to further reduce the impact of activity shifts on average price estimates.
The FNB House Price Index’s main segments are now as follows:
- Sectional Title:
- Full Title:
The size cut-offs for “small”, medium” and “large” differ per room number sub-segment. “Large” would refer to the largest one-third of homes within a particular room number segment over the past 5 year period, “Medium” to the middle one-third, and “Small” to the smallest one-third of homes within that segment.
Note on the FNB Valuers’ Market Strength Index: *When an FNB valuer values a property, he/she is required to provide a rating of demand as well as supply for property in the specific area. The demand and supply rating categories are a simple “good (100)”, “average (50)”, and “weak (0)”. From all of these ratings we compile an aggregate demand and an aggregate supply rating, which are expressed on a scale of 0 to 100. After aggregating the individual demand and supply ratings, we subtract the aggregate supply rating from the demand rating, add 100 to the difference, and divide by 2, so that the FNB Valuers’ Residential Market Strength Index is also depicted on a scale of 0 to 100 with 50 being the point where supply and demand are equal.
Courtesy: FNB - First National Bank
![]()
JOHN LOOS: HOUSEHOLD AND PROPERTY SECTOR STRATEGIST FNB HOME LOANS
011-6490125
THEO SWANEPOEL: PROPERTY MARKET ANALYST FNB HOME LOANS
011-6320604
The information in this publication is derived from sources which are regarded as accurate and reliable, is of a general nature only, does not constitute advice and may not be applicable to all circumstances. Detailed advice should be obtained in individual cases. No responsibility for any error, omission or loss sustained by any person acting or refraining from acting as a result of this publication is accepted by Firstrand Group Limited and / or the authors of the material.
First National Bank – a division of FirstRand Bank Limited. An Authorised Financial Services provider. Reg No. 1929/001225/06

© 2005 - 2026 | Portfolio Property Investments | Powered by the PPI Business Platform