SA Property - PayProp Rental Index Annual Market Report 2013
The year that was...
For the first time ever PayProp is combining our eagerly anticipated quarterly market reports into a combined review of the residential letting market for the preceding calendar year.
South Africa has 1.7 million rental properties. Around a quarter of those are managed by letting agents, whom we estimate to number more than 6 000 out of a total of about 10 000 estate agencies.
Origins of the PayProp Rental Index
The PayProp Rental Index was created in response to client requests for our insights into the letting part of the property market. Historically the industry could draw on a lot of detailed sales data, but had very little reliable information on average rentals, growth rates, damage deposit ratios and agent commissions.
At the time, as the largest processor of residential letting transactions in South Africa, PayProp helped our clients manage more than 35 000 properties with our state-of-the-art trust account environment. Our view was that this provided a statistically significant enough sample to draw conclusions from, and thus the idea of the PayProp Rental Index was conceived.
We were further extremely fortunate in securing one of South Africa’s leading economists, Mike Schüssler, to assist us with conceptualising, designing and building the Index, which was launched in December 2011 at South Africa’s first ever State of the Rental Industry conference.
Since then the PayProp Rental Index has grown from strength to strength. Currently, we draw our information in the form of actual transaction data from a sample base of 60 000 active rental properties, bringing South African real estate professionals the most complete, up-to-date and accurate analysis of the rental market. And we will continue to do this free of charge, because we feel that an industry with sound information is one that can make better decisions.
Just how big is the rental market?
Big as it got, we couldn’t help wondering how much ground we were actually covering.
1.7 million rentals
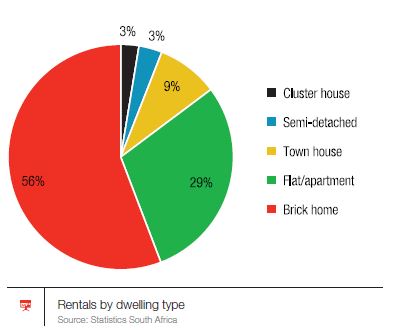
There are varying views on the critical question of the size of the rental market, depending on which method of calculation is used. According to Statistics South Africa’s General Household Survey (revised in October 2013), there are just over 1.7 million homes in the ‘formal’ residential letting market. This is substantially bigger than we had previously thought.
Broken down by property type the distribution looks as follows:

11 000 agencies
The next important question is, how many of these are managed by agents versus independent landlords?
To answer this question, PayProp embarked on a massive research project in the last two months of 2013. We phoned every estate agency whose details we could find and asked the simple question – “Do you manage a rental portfolio?” In total, we reached just under 5 000 estate agents, of which 63% answered in the affirmative.
…two thirds of whom do rentals
We further know that the Estate Agency Affairs Board (EAAB) issued 10 944 firms with fidelity fund certificates in 2013, which means that there may be around 6 000 managing agents in South Africa.
…managing 25% of rentals
Just how many properties do South Africa’s 6 000-plus rental agents manage? To get to a sensible answer, a little more statistical wizardry is required. Using the PayProp average portfolio size as a basis and adjusting for varying portfolio sizes in the rest of the market, we estimate that the 6 000 or so letting agents manage a total of 380 000 residential rentals. That represents just less than 25% of the total rental market – leaving over a million rental units in the hands of private landlords.
Let us sum that up. South Africa has 1.7 million rental properties – that is, ‘formal homes’ occupied by tenants as opposed to their owners. Around a quarter of those are managed by letting agents, whom we estimate to number around 6 000 or more out of a total of about 10 000 estate agencies. That leaves close to 1.3 million rentals in the hands of private landlords.
With this bit of eye-opening context to frame our thinking, let us turn our attention to the current state of the rental market, as at the end of 2013.
A pretty good year
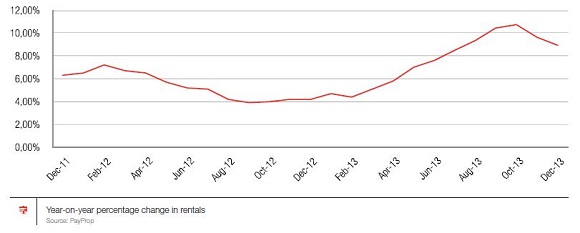
If we have to pin a single word on the market throughout 2013 it would have to be ‘recovering’. After a flat-to-negative 2012, our first-quarter report noted the first ‘green shoots’ of recovery — year-on-year rental increases of 5% and higher.
The tone of our second quarter report was even more upbeat – the recovery had not only maintained its momentum, but for the first time in more than 18 months, year-on-year increases beat inflation at 7%!
The third quarter report did not disappoint either, as the growth continued, breaking through the psychological 10% barrier. To keep our feet on the ground, fourth-quarter results show a slightly lower annual increase of around 9% — but note that this number held constant for each month of the quarter. This points to a probable stabilisation. Our expectation is that rental increases for 2014 will remain above 8%.

So what’s the average rental today?
In current circumstances, anyone will take an 8% increase. But 8% of what?
The positive growth data has resulted in average rentals climbing slowly throughout the year, from R5 473 in Q1 to the current R5 867 in Q4. At the projected growth rates we expect to see the weighted national average rental exceeding the R6 000 per month level for the first time since we started tracking rental data in October 2010.
A key element of the growth in rental values is the shift in the number of rental contracts per price band. As the weighted national average moves closer to R6 000, we see a drop in rentals priced R2 500 to R5 000. Interestingly, we see increases in the R5 000 to R7 500 and R10 000 to R15 000 price bands that exceed the drop-off in the lower categories. This means tenants with lower-value leases are not just ‘graduating’ to more expensive leases, but new tenants coming into the market are starting at higher rental values.
The provincial race
When we launched the PayProp Rental Index, the expectation was that the economic engine rooms of Gauteng and the Western Cape would lead the pack in average rentals. Against all expectations, Mpumalanga took the lead as the most expensive province to rent in. Upon delving deeper into this, we were reacquainted with an age-old first principle of economics, namely supply and demand.
We didn’t expect demand in this outlier province to be so manifest, but what we saw in towns like Lephalale, Limpopo was exactly that. When industrial development meets limited rental stock, rentals values shoot up dramatically. This has been a recurrent theme in the cases of Limpopo, and later in the year, the Northern Cape.
It is interesting to see that while Mpumalanga is currently still in the lead on an annualised basis, it was briefly overtaken by Limpopo for the duration of Q2, a feat repeated by Gauteng in Q4.
When casting our minds ahead it is useful to look at growth in provincial rentals. The Northern Cape is the clear leader in sheer velocity of growth, a fact corroborated by the ABSA House Price Index for 2013. Based on that, we expect average rental values in that province to exceed those in the Western Cape and KZN within the next two quarters.
Another trend to take note of is the decline in quarterly growth rates in Limpopo. A more in-depth study is needed to understand why, but one possible explanation is the impact of continuing strikes in the mining industry on industrial activity, and, accordingly, on demand for rental accommodation.
Getting down to towns
Analysing town data typically yields more erratic results than provincial equivalents, because sample sizes are smaller and more likely to fluctuate as a result of prevailing dynamics. For example, a student town like Stellenbosch shows dramatic rental increases in October and November each year, as new student leases are negotiated for the following year. A subsequent but unrelated dip often follows at the end of the first term, as students drop out and landlords are forced to drop their prices.
A consistent top performer is the Limpopo town of Lephalale, which has held its position of demanding the country’s highest rentals for two years. It is another remarkable example of rapid industrial expansion in an area with low rental supply, causing dramatic shifts in the market. Below Lephalale we see the usual suspects – traditionally affluent neighbourhoods such as Hout Bay, Bryanston etc.
Yields picking up for investors
Over the past few years we have spent a lot of time refining our yield calculation – a hugely important number for investors. We eventually settled on a comparison of values invoiced to tenants with actual values paid into owner accounts. Using actual income along with the ABSA House Price Index, we have been able to arrive at highly accurate gross (before landlord costs) and net (after landlord costs) yields, on a national as well as provincial level.
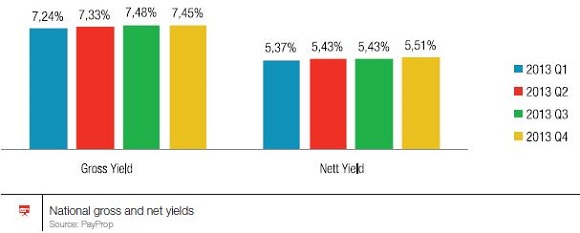
The graph below records slow improvements in national gross and net yields. Gross yields grew by 2.95% between January and December — a number not in line with average rental increases (almost 5% over the same period). This merits further explanation. The yield number tells us what type of return an owner would get if they bought a house right now, not necessarily what yield owners are getting who bought before
An owner who bought last year is likely to achieve a higher yield because his asset was most likely acquired at a lower cost than the sum paid by someone getting into the market now.
Gross yield is one thing, but after deducting landlord costs such as agent commissions, rates and taxes and repairs from the rental amount, owners are earning just 5.51% in net yield. This return has grown by 2.6% since January 2013, slightly slower than the gross number. The reason for this is that landlords’ expenses have grown faster than their ability to demand rental increases. Provincially the picture differs as dramatically as with other indicators. As expected, given the high rentals in these areas, we see much higher percentage yields for landlords in areas like Limpopo, the Northern Cape and Mpumalanga than in the rest of the country.

How many are enough?
The improving yield numbers may further explain why there is a gradual upwards trend in the number of properties owned per investor.
Although the growth has been gradual, the average owner on PayProp now owns just under 1.4 properties compared to when we started the rental index, when the number was just above 1.3. This may point to first-time investors becoming more confident in the ability of secondary property to generate returns and acting on it.
Tenant total cost
Many lease agreements place the obligation for monthly levies and municipal accounts on the tenant. Gauteng, in particular, is an extremely expensive area for tenants to stay in.
On average, over and above their R6 252 average rental, tenants also pay R852 in municipal costs as well as R954 in levies, bringing the total average monthly bill to R8 058 per month. In contrast, the Free State is the cheapest province to live in, at a total cost of occupation of only R5 496 per month.
Something’s got to give
While the data looks positive on the whole, we do feel concern for some of the underlying dynamics alluded to in our figures.
As we mentioned in our Q3 report, it is great for landlords and agents to see rentals increasing at rates above inflation, but this does not necessarily flow from a position of comfort for consumers. In fact, we believe that the shortage of rental properties is leading to owners asking and getting higher rentals than affordability dictates. All the supporting economic data — inflation, declining retail sales etc. — points to consumers increasingly being under financial strain.
On the other hand, landlords are not better off either. As mentioned above, while gross yields have grown by 2.90%, net yields have only increased by 2.6%, which means that landlords’ costs of ownership have grown even faster than rentals. Landlords are essentially playing catch-up and have merely been fortunate that the market structure has enabled them to do so.
What does this mean for the future? Our concern is that the cracks may soon start to show. The risk is that tenants agreed to higher rentals than they can afford, in order to secure a property, and the growing cost of living may yet lead to them defaulting on payments.
One light at the end of this tunnel is that the nature of tenancy allows for a quicker scale-down decision than is possible with a purchased home. With the advent of the Consumer Protection Act, making a 20- day notice period by tenants a right, it is much easier and faster for a tenant under pressure to move to a smaller or more affordable home.
Our five predictions for 2014
We usually leave predictions to economists, but based on our analysis of the range of data we have accumulated, these are the five trends we expect to see in 2014:
- Average rental growth will peak at 10% and gradually settle between 8% and 10%, as consumer pressure starts mounting.
- Tenant payment data will deteriorate slightly as the economy tightens.
- Damage deposit ratios will keep growing despite plummeting affordability, as owners seek protection against tenants ending contracts prematurely, resulting in greater uptake of deposit guarantee products.
- Property investors will not see yields above 6% this year. Despite the growth in rentals, they are also likely to experience an increase in the cost of ownership.
- Growth in the Northern Cape rental market is likely to be a strong theme in the months ahead, as the combination of industrial development and property scarcity combine to drive up rentals.
PayProp Rental Index
The PayProp Rental Index is a quarterly guide on trends in the South African residential rental market, and is compiled from actual transactional data collected by PayProp, the largest processor of residential letting transactions in South Africa. This edition details market conditions for the four quarters of 2013 combined.

Contact details
This publication has been produced by PayProp South Africa. PayProp South Africa is operated under license from GivenGain International Limited. PayProp and the PayProp logo are registered trademarks of GivenGain International Limited.
For enquiries, please contact:
Louw Liebenberg
CEO: Property Payment Solutions (Pty) Ltd
Email: [email protected]
Tel: 087 820 7368
The PayProp Rental Index is available from the PayProp web site at www.payprop.co.za.


