International Prices - Prime central London property hits record growth streak
Results for January 2014
- Annual growth of 7.8% in January
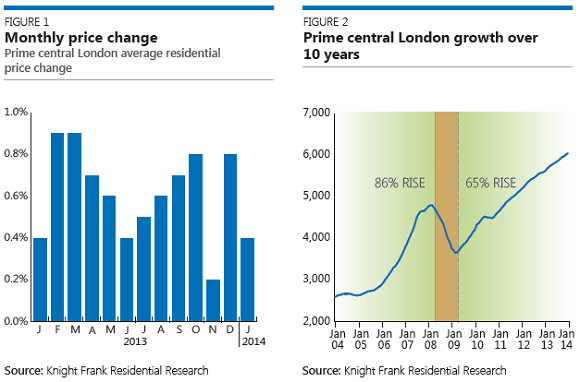
- January 2014 marks record 39 months of consecutive growth
- Prime central London index has risen 135% over last decade
- Growth was stronger in the runup to the financial crash than the more recent recovery phase
- 2013 sales volumes jump as appeal widens beyond ‘safe haven’ investment
Prime central London property has outperformed many other investments over the last decade. Growth is slowing as it breaks a record for consecutive monthly rises, but a jump in transactions suggests its appeal is widening beyond a ‘safe haven’ investment, says Tom Bill.
Ten years ago this month Knight Frank began producing the prime central London index on a monthly basis.
The index has risen 135% since January 2004, when interest rates were 3.75%, the third Lord of the Rings film topped the UK box office and £1 million bought you a two-bedroom flat on the upper floor of a converted building on a garden square in Knightsbridge.
Today, £1 million would buy a basementlevel studio flat on the same square.
Such strong growth has been most recently linked to central London’s reputation as a safe haven in the aftermath of the financial crisis and during periods of global political instability, including the Arab Spring.
In fact, growth was 86% in the buoyant years between the start of 2004 and the pre-crash peak in March 2008, higher than the 65% rise since the post-Lehman Brothers low in March 2009 when London property gained its status as a defensive investment.
Whatever the rationale, prime central London growth eclipses the 25% registered by the Nationwide UK house price index over the same period and beats other investments, including the FTSE 100 share index, over a ten-year period marked by the largest financial crash since the Great Depression. On page two, we examine the rise in more detail and how it compares to other investments.
The prime central London index began as a quarterly benchmark in June 1976, when interest rates were 11.5% and The Omen was released in UK cinemas. Since then the index has risen by a factor of 60 with the Mayfair district leading the way. A Mayfair house worth £345,186 (the current London average) in 1976 would now be worth £23.6 million.
The other milestone reached this January is that it marks a record 39 months of consecutive growth, the longest such period in the last decade.
Monthly growth in January was 0.4%, which took the annual increase to 7.8%. It is the highest annual growth figure since March last year but lower than the 11.9% recorded in January 2011 or 10.3% in the same month in 2010.

PRIME CENTRAL LONDON APPEAL WIDENS BEYOND A SAFE HAVEN
Price growth has slowed in prime central London as buyers and sellers digest a recent series of tax changes but a 37% increase in transactions last year shows more people are spending more money in prime central London as global economic threats recede.
The rise is due to a growing sense of medium to long-term confidence and a property market evolving beyond its safe haven status as signs of economic growth return to the UK.
Transactions increased across all price bands, including a 33% jump between £1 million to £2 million, 88% between £4 million and £5 million and 42% for £10 million-plus homes.
A growth in the number of UK-domiciled buyers also underlined how prime central London was less reliant on overseas capital flight. They accounted for 74% of deals last year compared to 68% in 2011. At the same time the number of European buyers fell from 16% to 11% last year and there were no Greek-domiciled buyers in 2013 for the first time in four years.
Source: Knight Frank Residential Research

RESIDENTIAL RESEARCH

Tom Bill - Associate, Residential Research
+44 20 7861 1492
PRESS OFFICE
Daisy Ziegler
+44 20 7861 1031
The Knight Frank Prime Central London Index, established in 1976, is the longest running and most comprehensive index covering the prime central London residential marketplace. The index is based on a repeat valuation methodology that tracks capital values of prime central London residential property. ‘Prime central London’ is defined in the index as covering: Belgravia, Chelsea, Hyde Park, Islington, Kensington, Knightsbridge, Marylebone, Mayfair, Notting Hill, Regent’s Park, St John’s Wood, Riverside* the City and the City Fringe. ‘Prime London’ comprises all areas in prime central London, as well as Canary Wharf, Fulham, Hampstead, Richmond, Wandsworth, Wapping and Wimbledon.


