


PAYPROP RENTAL INDEX - Continued Market Growth
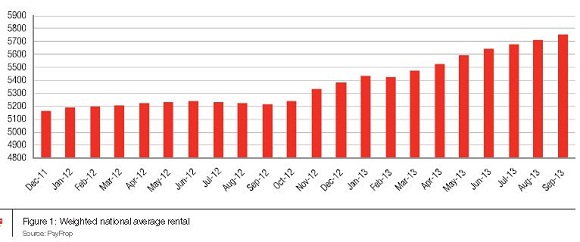
Since October 2012 the PayProp Rental Index has recorded strong and steady growth in the national average rental value. As of 30 September 2013, this number stands at R5 757, following a quarter of extremely strong growth.
For the first time since October 2010, the year-on-year increase in average rental values is higher than 10%, settling at 10.45% more than October 2012. The 10% barrier is an important psychological breakthrough for landlords, who have traditionally sought increases of that order at times when the market was more buoyant.
Underlying market dynamics
There are, however, questions about the cause and sustainability of this surge in growth over the last 12 months, as generally available economic data paints a picture of consumers under pressure. A likely scenario is that the high increases are in fact the result of stock shortages in the letting market.
This view is borne out by data from the likes of John Loos of FNB, which reveals that, in 2001, just more than 25% of home purchases were made by buy-to-let investors. Since 2009, this number has decreased dramatically. Currently, less than 9% of home purchases are intended to be investment properties. This has had the effect of limiting stock in the rental market, leading to artificially high rentals resulting from a mismatch between supply and demand.
We have previously seen similar trends on a more localised level in towns such as Lephalale, where rapid industrial expansion has created a short-term shortage of rental accommodation, resulting in abnormally high prices.
Another indicator often affected by such situations is the ratio of damage deposits held as a percentage of rentals invoiced. Typically, periods of stock shortages lead to an increase in this ratio, as landlords are able to command more security as part of the rental contract. As seen in the graph below, this number has been steadily increasing since October 2012, to the point where average damage deposits relative to rentals are no less than 131%.
While this bodes well for landlords who want more security, it puts further pressure on tenants. When renting a property in current market conditions, one has to fork out on average R13 281 up-front, a sum made up of the first month’s rental and deposit. This excludes contract fees, which could add another R1 000 to the total. In this context, affordable financial products that provide deposit guarantees are more likely to gain traction than over-burdening consumers any further.
A provincial view
The index further reveals a shift in ranking between the top three provinces as concerns average rentals, from the second to the third quarter. In Q2, the highest average rentals were achieved in Limpopo, followed by Mpumalanga and KZN. In the latest quarter Mpumalanga has taken the lead, with Limpopo dropping to second and Gauteng moving up to third place. Interestingly, we have seen continued growth in the Northern Cape, as predicted in previous indices. The momentum there is such that rentals in that province now exceed those of the Western Cape.
Year-on-year provincial growth
Rentals
A number of trends merit consideration here, including the continued recovery of rentals in the Eastern Cape. Whereas average rentals in this area were declining by this time last year, we have seen a steady return to positive territory, with year-on-year growth at a current high of 11.18% in September. Unfortunately, the Free State has not been able to emulate this feat, as the region still struggles with marginal growth.
On the positive side, the phenomenal 19.94% growth in the Northern Cape shows just how fast things can change. Over the past year the growth rate in this region has steadily gained momentum, to the point where it is currently the fastest-growing region in the country. Further afield we have seen growth in Mpumalanga and Limpopo stabilise at firm levels, which could point to a gradual normalisation of supply and demand in the area. The big trio of the Western Cape, Gauteng and KZN have all ended the quarter at growth rates of around 10%.
Damage deposits
When ranking the provinces’ ability to extract damage deposits (in relation to rentals), the positive trend in the Eastern Cape continues with deposit levels increasing dramatically. Similarly, areas such as Limpopo, the Western Cape and KZN have been able to steadily grow their damage deposit percentages. The Northern Cape is the one anomaly – despite rapid growth in average rentals, a very low level of deposits is being held on average, which could be result of short term affordability issues.
Continued middle class growth
As in previous indices, we see the number of rentals in the R2 500 – R5 000 price category stagnating, mostly in favour of the R5 000 – R7 500 price band, which is by far thefastest-growing. The second-fastest growth was recorded in the R7 500 – R10 000 price category, with limited gains in the number of rentals in the remaining categories above R10 000 per month.
Revised yields for investors
The PayProp Rental Index traditionally presented net yields as the difference between the prevailing average rental value and the average cost of ownership, expressed as a percentage of the average house price as reported in the ABSA house price index.
In this quarter, however, we introduce a new, more accurate methodology, using information available exclusively to us as the country’s largest processor of residential letting transactions (and hence, also the largest payer of funds to private property investors). By looking at the actual payment data for property owners, we have a better indication of what property owners actually receive relative to the cost of acquiring a property, and we present it here in ratio form, relative to average nominal house prices for small and medium houses.
The revised numbers show a marginally declining gross yield of 6.79% and a last-quarter net yield of 5.21% — compared to yield numbers of 6.49% and 5.06% respectively when using the previous model.
Because of the level of detail available in PayProp’s data we have further decided, for the first time, to present net yields on a provincial basis. Note the high yield levels in Limpopo and Mpumalanga – two areas that have traditionally stood out with high average rentals.
A further interesting number is the flipside of the net yield coin – the ‘cost of ownership’ as a percentage of rentals collected before the owner’s portion is paid out. While the trended average is 25%, we see a steady increase in the percentage of income the owner has to sacrifice to keep and maintain the property. Currently the average is 27.8%. Gauteng owners pay the most (31.3% of rent received), and owners in the North West the least with 23.6%.
Auxillary costs
Auxillary costs continue to rise, with levies and water & electricity costs showing the greatest increases.
Average properties per owner
PayProp records the average number of properties owned by a single owner over time in order to understand the underlying structure of private property investment. For example, is growth in supply of rental stock at any one time the result of more investors entering the market, or are current investors investing more?
At this point, the average owner on PayProp owns 1.4 properties – marginally up from the 1.34 of October 2011. It may point to a revival in investor appetite as the benefits of sustained increases in rentals accrue.
Slow recovery in agent commission levels
The long-term trend in agent commissions is downward, from a high of 10.25% in March 2012 to a low of 9.90% in November 2012. Despite a period of flat growth between November 2012 and June 2013, the last quarter has shown an upward swing in average commissions that agents command. While still near the 10% level, it is encouraging to see that the trend is reversing and that agents are actively protecting their income.
Courtesy: PayProp

PayProp Rental Index
The PayProp Rental Index is a quarterly guide on trends in the South African residential rental market, and is compiled from actual transactional data collected by PayProp, the largest processor of residential letting transactions in South Africa. This edition details market conditions for the third quarter of 2013.
Contact details
This publication has been produced by PayProp South Africa. For enquiries, please contact:
Louw Liebenberg
CEO: Property Payment Solutions (Pty) Ltd
Email: [email protected]
Tel: 087 820 7368

© 2005 - 2026 | Portfolio Property Investments | Powered by the PPI Business Platform