


URBAN HOUSE PRICES GLOBALLY RISE AT THEIR FASTEST RATE FOR TWO YEARS
Chinese cities have climbed the rankings but recent strong performers such as Istanbul and Stockholm are starting to wane. Kate Everett-Allen examines the latest set of results.
Results for Q2 2016
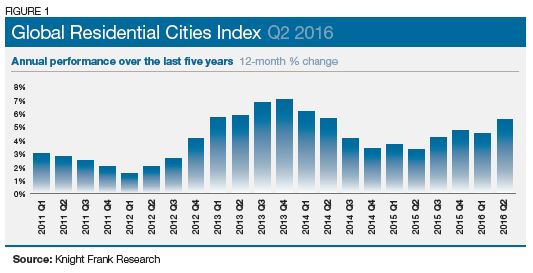
Urban house prices across 150 key cities around the world increased by 5.5% on average in the year to June 2016, according to the Knight Frank Global Residential Cities Index. This represents the index’s strongest aggregate growth in two years.
Of the 150 cities tracked by the index, 114 recorded positive annual price growth in the year to June and, of these, 31 cities saw price growth exceed double digits.
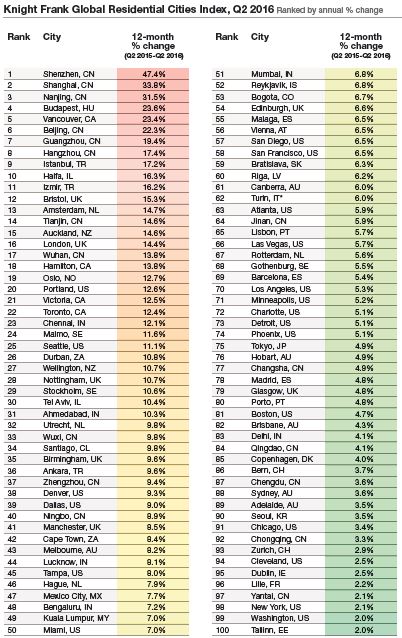
The Chinese city (and rapidly-expanding technology hub) of Shenzhen continues to lead the rankings, although its annual rate of growth has slowed significantly from 63% last quarter to 47%.
Due in part to Shenzhen’s slower rate of growth, the gap between the strongest and weakest performing city housing market has shrunk from 74 percentage points in March 2016 to 59 points in June.
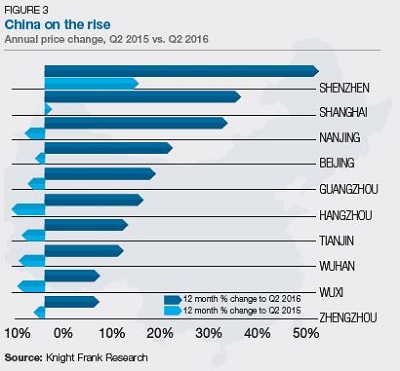
Six Chinese cities (Shenzhen, Shanghai, Nanjing, Beijing, Guangzhou and Hangzhou) all sit within the top ten rankings for annual price growth. Their ascension has been rapid. According to data from China’s National Bureau of Statistics the average annual rate of growth for the top ten performing Chinese cities equates to 22% in the year to June, a year earlier the comparable figure was -1.1% for the same ten cities (figure 3).
A number of the municipal governments in China are now introducing a new raft of stringent cooling measures at a local level to dampen sales, these range from limiting non-locals to single home purchases and tightening rules for local residents in relation to second home purchases.
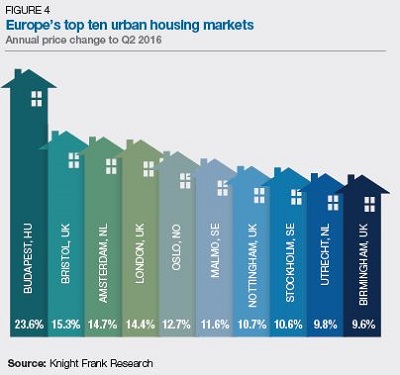
In Europe, Budapest leads the rankings with prices accelerating 24% on an annual basis but cities in the UK, the Netherlands and Scandinavia are also well represented. Four of the continent’s top 10 performing cities are in the UK: Bristol, London Nottingham and Birmingham (figure 4).
Moscow (-11%) and Jaipur (-10%) occupy the bottom two rankings this quarter, in both cases sluggish economies are having a direct impact on housing demand.
Other cities slipping in the rankings over the last quarter include Istanbul (3rd to 9th), Stockholm (6th to 29th) and Auckland (8th to 15th).
The index tracks the period until the end of June, our next edition will provide some insight into the impact of a number of key political and economic events; the UK’spost EU referendum trajectory, the impact of Vancouver’s new tax for foreign buyers and the extent to which China’s cooling measures are taking effect.
Note: Where official data is published for multiple cities we have selected those cities with the highest GDP or included only those cities tracked by official source.
Source: Knight Frank Research *Asking prices **Provisional ***Metropolitan area AT Austria, AU Australia, BR Brazil, CA Canada CH Switzerland, CL Chile, CN China, CO Bogota, CY Cyprus, CZ Czech Republic, DK Denmark, EE Estonia, ES Spain, FI Finland, FR France GR Greece, HK Hong Kong, HR Croatia, HU Hungary, ID Jakarta, IE Ireland, IL Israel, IN India, IS Iceland, IT Italy, JP Japan, KR South Korea, LV Latvia, MK Macedonia, MX Mexico City, MY Malaysia, NL Netherlands, NO Norway, NZ New Zealand, PT Portugal, RU Russia, SE Sweden, SG Singapore, SI Slovenia, SK Slovakia, TR Turkey, TW Taiwan, UK United Kingdom, US United States, ZA South Africa
All data corresponds to 12-month percentage change to Q2 2016 except: Ahmedabad (Q1 2016), Auckland (Q1 2016), Bengaluru (Q1 2016), Budapest (Q1 2016), Chennai (Q1 2016), Delhi (Q1 2016), Jaipur (Q1 2016), Kanpur (Q1 2016), Kochi (Q1 2016), Kolkata (Q1 2016), Kuala Lumpur (Q4 2015), Larnaca (Q1 2016), Lille (Q4 2015), Limassol (Q1 2016), Lucknow (Q1 2016), Ljunljan (Q1 2016), Lyon (Q4 2015), Marseille (Q1 2016), Mumbai (Q1 2016), Nicosia (Q1 2016), Santiago (Q3 2015), Vienna (Q1 2016), and Wellington (Q1 2016).
Courtesy: Knight Frank

RESIDENTIAL RESEARCH
Liam Bailey - Global Head of Research
+44 20 7861 5133
Kate Everett-Allen - International Residential Research
+44 20 7167 2497
PRESS OFFICE
Astrid Etchells - International PR Manager
+44 20 7861 1182
Important Notice
© Knight Frank LLP 2016 – This report is published for general information only and not to be relied upon in any way. Although high standards have been used in the preparation of the information, analysis, views and projections presented in this report, no responsibility or liability whatsoever can be accepted by Knight Frank LLP for any loss or damage resultant from any use of, reliance on or reference to the contents of this document. As a general report, this material does not necessarily represent the view of Knight Frank LLP in relation to particular properties or projects. Reproduction of this report in whole or in part is not allowed without prior written approval of Knight Frank LLP to the form and content within which it appears. Knight Frank LLP is a limited liability partnership registered in England with registered number OC305934. Our registered office is 55 Baker Street, London, W1U 8AN, where you may look at a list of members’ names.

© 2005 - 2026 | Portfolio Property Investments | Powered by the PPI Business Platform