


Results for Q2 2016
ALL IN MODERATION: GLOBAL HOUSE PRICES CONVERGE
Steady price growth is the new norm as the outliers have largely disappeared from the index in recent quarters. Kate Everett-Allen analyses the latest index results.
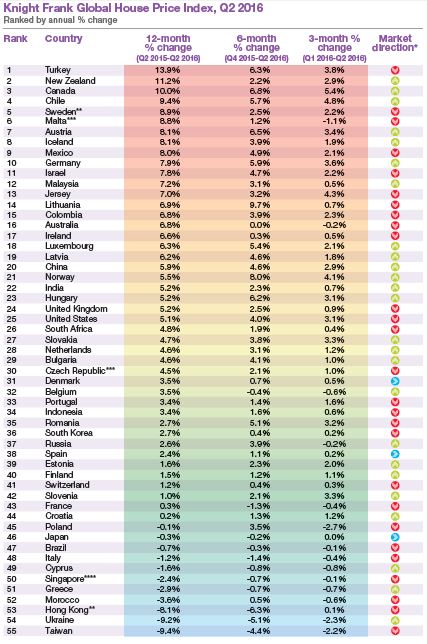
Over recent quarters Turkey, Sweden and New Zealand have occupied the top positions in our Global House Price Index whilst key Asian markets have dominated the lower ranks. This quarter is no different.
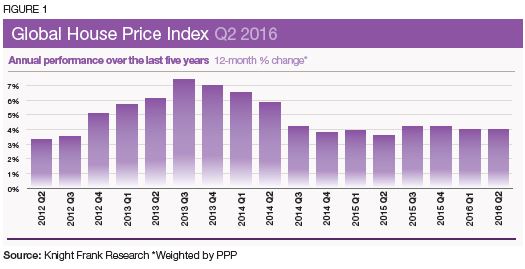
The overall aggregate index has followed a similar narrative, consistently recording 4% annual growth, or thereabouts, for the last two years (figure 1).
Yet closer inspection shows the extremes are moderating. The percentage points separating the strongest and weakest performing housing market have narrowed from 33 points in Q3 2015 to 23 this quarter.
For the western world, a prolonged period of historically low interest rates and timely injections of QE may in part be responsible.
Of our top five performing countries, Turkey and Sweden are the only two markets where price growth has slowed compared with last quarter, down from 19% to 14% and from 13% to 9% respectively.
Our index tracks nominal price growth but if we consider real price growth, where inflation is stripped out, New Zealand finds itself in first place with 11% annual growth whilst Turkey – with inflation in excess of 7% – is pushed down into 13th position.
The latest data suggests the build-up to the Olympic Games was unable to act as a counterbalance to Brazil’s slowing economy and housing market. Average prices slipped by 0.7% year-on-year whilst Rio saw prices fall by 3.6% over the same period.
China’s average house price growth stood at 5.9% in the 12 months to June but the gap between the top five performing cities (Beijing, Guangzhou, Sanya, Shanghai and Shenzhen) and China’s remaining 657 cities (100 of which have a population of more than 10 million) is widening. The government has unveiled a series of measures in recent months to either spur on, or curb investment, depending on the level of activity in the different city tiers.
The Asian markets of Hong Kong, Taiwan and Singapore occupy three of the bottom five rankings this quarter. Weak economic growth, stringent cooling measures and the strong US dollar continue to hamper sales rates.
All eyes in the coming months will be on the UK and the US, both housing markets have been level pegging in the last year, recording annual growth of 5.2% and 5.1% respectively.
The outcome of the US presidential election and the negotiations following the UK’s Brexit decision will ultimately determine the confidence of owner occupiers and the flow of investor capital across a large part of the world in the short to medium term.
Source: Knight Frank Research
*Direction of annual price growth compared to previous quarter
**Provisional ***Asking prices ****Island-wide price index for non-landed private properties
Data for Australia, Austria, Belgium, Bulgaria, Colombia, Croatia, Cyprus, Czech Republic, Denmark, Finalnd, France, Hungary, India, Israel, Italy,
Lithania, Luxembourg, Morocco, New Zealand, Romania, Solvenia and Spain to Q1 2016; Data for Malaysia to Q4 2015; Data for Chile to Q3 2015
Courtesy: Knight Frank

DATA DIGEST
The Knight Frank Global House Price Index established in 2006 allows investors and developers to monitor and compare the performance of mainstream residential markets around the world. The index is compiled on a quarterly basis using official government statistics or central bank data where available. The index’s overall performance is weighted by GDP on a Purchasing Power Parity basis and the latest quarter’s data is provisional pending the release of all the countries’ results.
RESIDENTIAL RESEARCH
Liam Bailey - Global Head of Research
+44 20 7861 5133
Kate Everett-Allen - International Residential Research
+44 20 7167 2497
PRESS OFFICE
Astrid Etchells
+44 20 7861 1182
Important Notice
© Knight Frank LLP 2016 – This report is published for general information only and not to be relied upon in any way. Although high standards have been used in the preparation of the information, analysis, views and projections presented in this report, no responsibility or liability whatsoever can be accepted by Knight Frank LLP for any loss or damage resultant from any use of, reliance on or reference to the contents of this document. As a general report, this material does not necessarily represent the view of Knight Frank LLP in relation to particular properties or projects. Reproduction of this report in whole or in part is not allowed without prior written approval of Knight Frank LLP to the form and content within which it appears. Knight Frank LLP is a limited liability partnership registered in England with registered number OC305934. Our registered office is 55 Baker Street, London, W1U 8AN, where you may look at a list of members’ names.

© 2005 - 2026 | Portfolio Property Investments | Powered by the PPI Business Platform