


As 2011 has reached a close, the FNB House Price Index is on a slowing growth trend once again, after a brief uptick around mid-year. The end of year average house price was still 3.2% higher than November a year ago (year-on-year), but this represents a slower growth rate than the October/November revised year-on-year growth rate of 4%, and represents the 3rd consecutive month of slowing year-on-year house price growth.
The average price of homes traded, according to the FNB House Price Index, was R804,242.
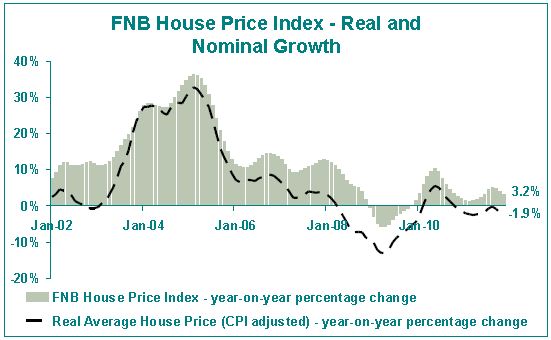
In real terms, i.e. when prices are adjusted for general consumer price inflation, the October FNB House Price Index declined by -1.9% year-on-year (November consumer price data not yet available), with consumer price inflation of 6% in that month significantly higher than the 4% nominal year-on-year growth in house prices.
The latest data point now means that, in nominal terms, the average house price in real terms is -16.6% lower than its long term peak reached in February 2008, a significant correction to date. In nominal terms, the index is a marginal +5% higher than it was in February 2008. However, compared to July 2000 when the index started, the average price at November 2011 was 209.5% higher in nominal terms, and 63.8% higher in real terms.
BUT MONTH-ON-MONTH PRICE TRENDS SUGGEST THAT THE MARKET HAS ALREADY BEEN IN A STATE OF PRICE DECLINE IN RECENT MONTHS
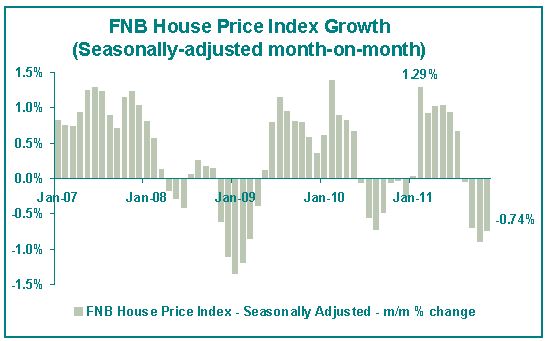
Due to seasonality in the house price data, it is essential to statistically adjust the time series in order to remove seasonality should one wish to use month-on-month growth rates as indicators of true (non-seasonal) momentum in the residential property market. On a month-on-month basis, the seasonally-adjusted FNB House Price Index shows the residential market to already have been in a state of nominal price decline (negative growth) for the past 4 months.
In November, the extent of this price decline on October was -0.74%, which is slightly less decline than the revised -0.89% measured in October. Since the seasonally-adjusted price decline started 4 months ago, the total decline has been -2.3%.
FNB’S VALUERS SUGGEST SOME SLIGHT DEMAND IMPROVEMENT RECENTLY, BUT CONTINUE TO POINT TO A MARKET WHERE DEMAND IS WEAK RELATIVE TO SUPPLY
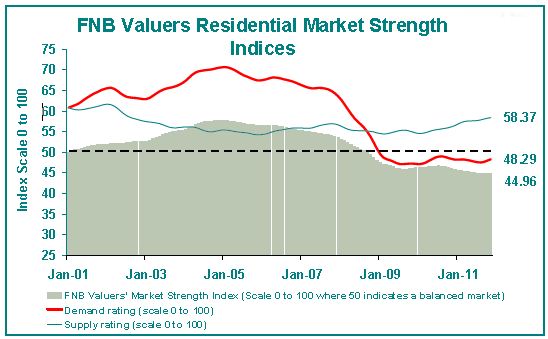
The FNB Valuers’ Market Strength Index continues to provide a plausible explanation for the ongoing weakness in nominal price growth, and even month-on-month decline, because it continues to point to weakness in demand relative to supply. The Market Strength Indices, i.e. the Demand Rating, the Supply Rating, and the Market Strength (Balance) Index are all calibrated on a scale of 0 to 100. 50 reflects the perfect balance between supply and demand in the Market Strength Index (in the valuers’ opinions), below 50 indicates excess supply and above 50 that demand is rated stronger than supply.
The Market Strength Index has been consistently below the crucial 50 level since September 2008. As at November 2011, this index recorded a level of 44.96, a slight improvement after a weakening trend since late-2010. This very mild strengthening in the Market Strength Index in November was due to a mild reported improvement in demand (with a reading of 48.29), possibly due in part to summer seasonal factors having an impact . However, the extent of the Market Strength Index strengthening was restricted by another very strong property supply rating by the valuers, to the order of 58.37.
All in all, though, the Market Strength Index remains well-below the crucial 50 level, implying stronger supply than demand, and suggesting that further downward price “correction” may be on the cards.
OUTLOOK FOR 2012
The FNB House Price Index, along with the FNB Valuers’ Market Strength Index, once again provide no surprises. The market remains very flat and looks likely to remain so for the foreseeable future.
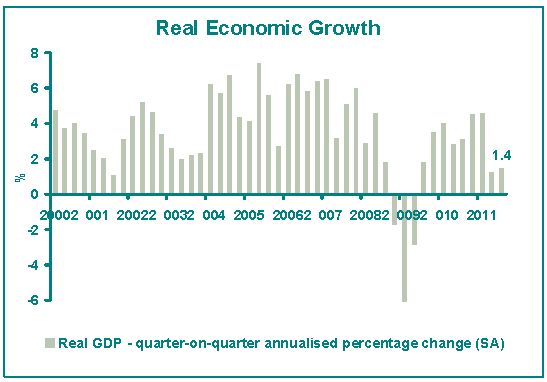
Economic Growth Prospects: At present, there is little obvious on the horizon to suggest any marked improvement in house price performance neat year. Earlier this week saw the release of 3rd quarter economic growth figures, confirming that South Africa had had another quarter of anaemic real economic growth to the tune of 1.4% on a quarter-on-quarter annualized basis. This was almost unchanged from the 1.3% previous growth rate, and is significantly lower than the 4.6% rate on which the year started. This should imply downward pressure on employment growth along with real disposable income growth, thus restricting residential purchasing power.
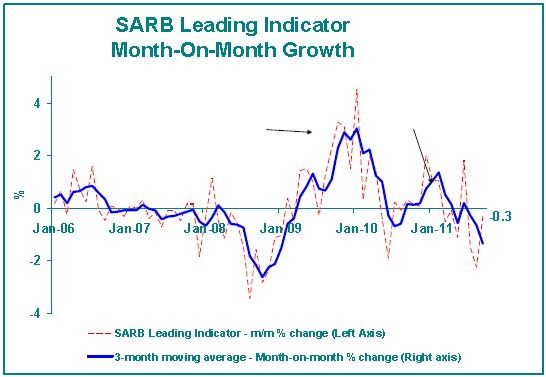
Looking at the Reserve Bank (SARB) Leading Indicator, which has been in month-on-month decline for the past 3 months, it suggests that the next few quarters’ growth rates could be as slow or even slower. The SARB has stated that one of the key negative influences on its Leading Business Cycle Indicator has been the weakness in the Composite Leading Indicator of SA’s trading partner countries. Yes, South Africa is heavily dependent on exports, and is thus heavily exposed to global economic events which don’t appear pretty at present.
Europe is the key area of economic concern at present, as a credit crisis threatens to get out of hand. But it goes wider than that. The World’s largest economy, the US, also has very high debt levels, making it highly vulnerable to external shocks such as high commodity prices, and being the major oil guzzling economy, currently high oil prices pose risks to that country’s economic growth. Its own Leading Indicator has also been in negative growth territory for some time.
Interest rate prospects: In 2012, a real possibility exists for further interest rate reduction. Year-on-year commodity price inflation has slowed in recent months, and should do so further in the 1st half of 2012 due to high base effects and a slowing economy which exerts some downward pressure on commodity demand. Therefore, the SARB is probably not unrealistic in forecasting a peak in the rising CPI inflation trend early next year. Given its official inflation target of 3% to 6%, should that inflation peak occur, and the rate start declining thereafter, the prospects for a further interest rate reduction would be enhanced.
However, we would caution against expecting major reduction. At 5.5%, the SARB’s repo rate is already negative in real terms, and the Bank has typically appeared to desire a healthy positive real interest rate. We have seen the SARB cutting very slowly since late-2009, despite a weak economy, suggesting that it is now a reluctant cutter of interest rates. We wouldn’t expect any different in 2012, and any reduction would be a minor one, probably not making a major difference to residential demand.
House Price Growth prospects: Given the expectation of a slower economic growth year in 2012, and slight interest rate reduction at best, the average house price growth for 2012 is expected to be still slower than in 2011. After the 2010 “mini-recovery” that produced an average house price rise of 6.1% for 2010 as a whole, 2011 looks set to end at an average rise of 3%. In 2012, we expect still slower nominal growth at between 1-2%. This would translate into further house price decline in real terms, with consumer price inflation expected to move in the 4-6% range during next year.
COMMENT: WHAT TO WISH FOR AND WHAT NOT TO WISH FOR IN 2012
For all of us, what we often wish for differs from what we expect to happen or what we ultimately get.
Whilst I believe that there is a good possibility that interest rates may go down slightly further, we are also of the view that for the property sector to place all its hopes on interest rate cuts is as questionable as the mining and manufacturing sectors hoping for a weaker rand to cure all of their ills.
The reality is that bringing the property market back to health is far more complex than merely cutting interest rates. In the USa early last decade, the Federal Reserve’s aggressive cutting of interest rates to what can be described as abnormally low levels given where that country’s inflation rate generally hovers, helped to sustain one of that country’s great housing booms through assisting households to keep growing their borrowing and indebtedness. That action also arguably contributed to one of the country’s greatest housing market crises, because “what goes down must go up” in interest rate speak, and when the Fed tried to normalize interest rates from 2004 to 2006, the house of cards came tumbling down, and still hasn’t recovered.
In South Africa, we should probably be grateful that the SARB follows what can only be described as a more sensible interest rate policy, and that it “stopped the property party” just in time in 2006-8 by hiking interest rates. To a lesser extent, we should probably also be grateful for a National Credit Act. One could argue that the last few rate hikes of that 2006-8 hiking cycle were an overkill, and a bit too painful, but a 15.5% peak in prime rate was not extremely high by our own historic standards. It was made to feel extreme by a household debt-to-disposable income ratio that reached an all-time record of 82% by early-2008. Perhaps, rather, one could argue that interest rates went too low prior to 2006, driving too much borrowing.
In short, we should be careful what we wish for. At 9% prime rate, our interest rates are at multi-decade lows already. Given our country’s “structural” inflation rate which is probably near to the higher end of the 3-6% target range, interest rates are low. Looking at the country’s savings rate, too, compared to our gross domestic investment, we see a big savings shortage as reflected in the current account deficit. This may even suggest that interest rates are too low.
For the housing market’s longer term health, it is important that the household debt-to-disposable income ratio be brought down to lower levels. From this point of view, the current level of interest rates appears to strike a nice balance, providing relief for highly-indebted households, assisting in a decline in our home loan arrears and non-performing loans in recent years, but on the other hand not yet having encouraged household borrowing growth to accelerate.
And so we have a very positive situation where household credit growth remains consistently below household income growth, translating into a declining trend in the household debt-to-disposable income ratio since early-2008. The household sector probably requires a few more years of this debt ratio reduction, we expect more decline in 2012, and believe that SARB interest rate levels should be set to encourage this decline.
Instead of interest rate cuts, what we should rather be writing to Santa for and hoping for in 2012 is a more significant improvement in the residential rental market. Whilst it is difficult to get a grip on residential yields, the perception is that, on average they remain unattractively low, possibly averaging a net yield of 5-6% (although higher at the lower priced end) based on some conversations I have (although I’m open to debate given a lack of data). More rapid price growth would only make the ”income stream prospects” less attractive. What appears really necessary to improve residential property’s attractiveness as an asset class is a strong rental market, coupled with slow capital growth for a while, in order to significantly increase net yields on property.
Slow capital growth looks likely. But I have yet to see signs of strong rental growth though. Rental inflation, according to Stats- SA, did start to accelerate in late-2010, but slowed once more in recent months, suggesting a tenant market which also has a significant degree of financial pressure. Indeed, the credit agency TPN reports a mild decline in the percentage of tenants in good standing with rental payments in recent times, especially in the below-R3,000/month rental segment as well as the above- R12,000/month rental segment. All is not yet solid in the rental market, it would appear.
A better-performing rental market is more a function of the economy than of interest rates alone. This in turn depends greatly on the global economy’s performance, which as mentioned looks fragile at present. And in the absence of any major government economic policy changes in the pipeline, there is little that the SARB alone can be expected to do for the residential property market in the current environment.
In short, therefore, my wishes for 2012 are not that the SARB will necessarily cut interest rates, although I believe there is a good chance of this happening. Rather, I believe we should wish for other economic policy changes that lie outside the area of SARB influence, and relate to improved government and parastatal service delivery, and labour market reforms to name but a few. For a good while to come, the SA economy should probably not depend too much on global economic growth, which looks set to be mediocre and erratic at best. Domestic economic policy/structural changes have probably never been more needed than they are now, in order to drive long term economic growth, and thus property market performance to higher levels. But the SARB has by-and-large done its bit.
However, although the options left to stimulate the residential market in the near term appear limited, 2012 is expected to see certain positive processes continuing. Households won’t be waiting for the policy authorities to do something. The household sector balance sheet rebuilding is expected to continue. This includes further decline in the debt-to-disposable income ratio, and increasingly “cutting the coat according to the cloth”.
We expect to see estate agents being surveyed continuing to tell us that a very significant percentage of sellers (currently hovering at near to 25%) will be selling their properties in order to downscale due to financial pressure, and I also finally expect SA’s dismal household sector savings rate to emerge from a net-dissavings rate (i.e. gross savings currently too little to cover depreciation on fixed assets) to more respectable levels. Additionally, we have seen households attempting to catch up on some homerelated spending backlogs, and the levels of home maintenance appears to have improved according to our surveys as well as according to retail hardware sales stats. I expect this process to continue too.
These are the “hard work” processes that are crucial to a healthy property market, but whose benefits are only felt with a long time lag. These are the positive developments that are expected to continue in 2012. But these processes that have to take place to lay the foundation for recovery are slow.
The “text book” big property cycle spans an average of 15-20 years. Given that 1998 was arguably the last big cycle bottom point, we are now 13 years into the current cycle. This would suggest a few more years of eliminating the various excesses and imbalances that exist before the market can flourish. 2012 promises progress in reducing the “excesses”, but it seems too early to expect this to translate into improved price performance.
Finally, the ongoing financial pressure for the time being, along with household efforts to rebuild balance sheets, leads to the expectation in 2012 that:
Source: John Loos (FNB)
![]()
Courtesy: The EAAB - Estate Agency Affairs Board

“Redressing the Past, Building the Future and Guiding the Real Estate Business towards Professionalism”
It is apparent, therefore, that the CPA could conceivably have severe implications not only for landlords, property developers and business owners but also estate agents and commercial- and business brokers.

© 2005 - 2026 | Portfolio Property Investments | Powered by the PPI Business Platform