Residential Research - Prime Global Cities Index
Results for Q1 2017
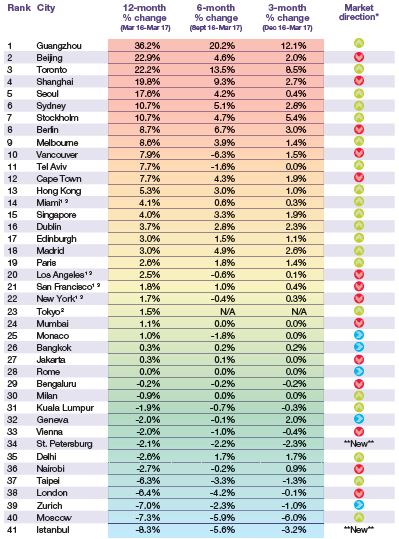
- Guangzhou leads the rankings with luxury prices up 36.2% in the year to March
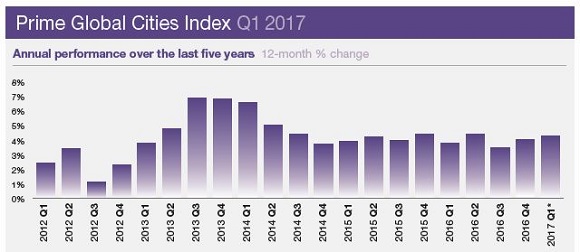
- Overall the index increased by 4.3% in the year to March
- Luxury prices in the world’s tech hubs are outperforming the world’s financial centres
- Toronto’s strong price growth has prompted new market restrictions
- Hong Kong (5.3%) and Singapore (4%) are rising up the rankings
CHINESE CITIES CONTINUE TO LEAD LUXURY PRICE INDEX
Last quarter the index’s performance showed signs of a slowdown, this quarter the index has surged, driven primarily by China’s key cities.
Source: Knight Frank Research, *Provisional
Our Prime Global Cities Index now tracks the movement of luxury residential property prices across 41 cities with the addition this quarter of Istanbul and St Petersburg. Overall the index climbed 4.3% in the year to March.
Although the world is in a state of political and economic flux at present and inevitably we are seeing a degree of safe haven investment flows into luxury property markets, the index’s upturn this quarter can largely be attributed to China’s cities which continue to dominate the top tier of the rankings.
Guangzhou witnessed a 36.2% increase in luxury prices over the 12-months to March. Beijing, Shanghai and Guangzhou recorded average price growth of 26.3%. Prices in the Guangzhou are rising from a lower base than in Shanghai and Beijing, the availability of residential stock is tighter and policymakers in the city were slower to introduce cooling measures which are now widely evident across most tier one cities.
Cities in the world’s other major economy, the US, are rising up our rankings. However, the big story on the North American continent is the acceleration of prices in Toronto – across all price bands. At the luxury level, prices ended the year to March 22% higher, outpacing Vancouver by some margin (7.9%). Such price inflation failed to escape the attention of policymakers leading to the announcement of a raft of new measures in April including a 15% foreign buyer tax putting the city on an equal footing with Vancouver.
Other centres of growth include Seoul (17.6%), Stockholm (10.7%), Berlin (8.7%) and Melbourne (8.6%) cities which all share a common theme; with notable clusters of technology businesses. Analysis in Figure 4 shows the established financial centres of the world are seeing slower price growth – on average 3.2% per annum – compared with the emerging tech hubs which saw prices rise by 7.4% on average over the 12-month period.
Although prime prices fell 6.4% in London in the year to March quarterly growth has climbed to its highest rate since May 2016, suggesting the capital is entering a period of stabilisation.
An Asian revival might be overstating it but we are certainly seeing the region’s key cities of Hong Kong (5.3%) and Singapore (4%) rise up the rankings following years of lacklustre growth. In March Singapore reduced its sellers’ stamp duty from 16% to 12% suggesting a softening in attitude but such a move is unlikely to open the floodgates to speculators given the 15% buyer’s stamp duty for foreign buyers remains in place.
Knight Frank Prime Global Cities Index, Q1 2017
Ranked by annual % change
Source: Knight Frank Research, S&P Case Shiller, Ken Corporation
DATA DIGEST
The Knight Frank Prime Global Cities Index enables investors and developers to monitor and compare the performance of prime residential prices across key global cities. Prime property corresponds to the top 5% of the housing market in each city, unless otherwise indicated. The index is compiled on a quarterly basis using data from Knight Frank’s network of global offices and research teams.
Courtesy: Knight Frank

RESIDENTIAL RESEARCH
Liam Bailey - Global Head of Research
+44 20 7861 5133
Kate Everett-Allen - International Residential Research
+44 207 167 2497
PRESS OFFICE
Astrid Etchells
+44 20 7861 1182
Important Notice
© Knight Frank LLP 2017 – This reportis published for general information only and not to be relied upon in any way. Although high standards have been used in the preparation of the information, analysis, views and projections presented in this report, no responsibility or liability whatsoever can be accepted by Knight Frank LLP for any loss or damage resultant from any use of, reliance on or reference to the contents of this document. As a general report, this material does not necessarily represent the view of Knight Frank LLP in relation to particular properties or projects. Reproduction of this report in whole or in part is not allowed without prior written approval of Knight Frank LLP to the form and content within which it appears. Knight Frank LLP is a limited liability partnership registered in England with registered number OC305934. Our registered office is 55 Baker Street, London, W1U 8AN, where you may look at a list of members’ names.