Residential Research - Global Residential Cities Index
RESULTS FOR Q4 2016
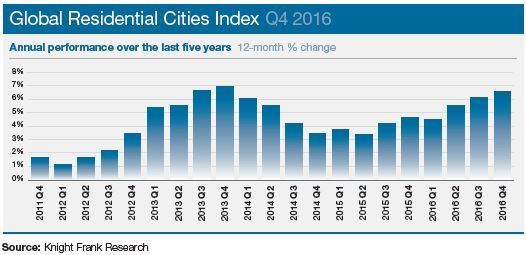
- House prices across 150 cities worldwide increased by 6.6% on average in 2016
- Chinese cities occupy the index’s top nine rankings for annual house price growth but we expect a marked change next quarter
- Wellington and Toronto have usurped their neighbours of Auckland and Vancouver respectively at the top of the table
- Oslo is Europe’s strongestperforming city but Dutch cities have also risen up the rankings
- No single world region dominates the bottom of the rankings with Moscow, Aberdeen, Seville, Darwin and Jaipur comprising the five weakest markets
CHINESE CITIES REACH THEIR PEAK IN 2016
House prices in China’s key cities rose ever higher in 2016 and made a significant contribution to our index’s overall performance but 2017 is shaping up to look very different.
Chinese cities account for nine of the top ten rankings in our latest assessment of house prices across 150 cities worldwide. Nanjing leads the rankings with average prices ending last year 41.1% higher. Chinese cities would have occupied the entire top ten had New Zealand’s Wellington not nudged Shenzhen out of tenth spot.
We expect next quarter’s results to look significantly different. The index covers the period to the end of 2016 but already in March we have seen a new round of lending curbs and purchase restrictions across China’s main cities which has brought price growth in several cities to an abrupt halt.
Overall the index increased by 6.6% in 2016, its highest rate in three years. However, if we were to omit the Chinese cities the index would have increased by only 4.9% in 2016.
Beyond China, the cities of Auckland (12.4%) and Vancouver (17%) which have for several years been New Zealand and Canada’s stellar performers have now been usurped by their respective rivals, Wellington (23.7%) and Toronto (19.8%). New regulations are only part of the story, Vancouver has seen a new tax on foreign buyers but investors are also keen to spread risk, with some equity-rich Aucklanders now looking for a foothold in the New Zealand capital too.
Oslo (21.7%) is Europe’s strongest performing city but Budapest (19%) is not far behind. In Oslo falling unemployment, record low interest rates and strong purchasing power has boosted demand. The Dutch cities of Amsterdam, Utrecht and Rotterdam represent another centre of growth in Europe, all recording double-digit annual price rises. Here, a lack of supply is the key determinant of accelerating prices.
Seattle (10.8%) continues to lead the US cities with Denver (8.9%) next in line. The impact of the Federal Reserve’s third rate rise in 10 years (to 1%) will filter into next quarter’s edition but we do not envisage a sudden slowdown in US cities’ price inflation. Furthermore, we may see stronger capital outflows from the US to key European and Asian cities.
In the UK, six of the eight cities tracked by our index recorded positive price growth, but only one, Bristol (10.1%) saw prices reach double figures. Improving economic productivity and a structural undersupply of new housing is supporting price growth in a number of the UK’s regional cities.
The foot of the rankings table remains largely unchanged with Moscow, Aberdeen, Seville, Darwin and Jaipur jostling for position within the bottom five. No single world region dominates, although the Americas are notable by their absence.
Courtesy: Knight Frank

CONTACT DETAILS FOR FURTHER INFORMATION:
RESIDENTIAL RESEARCH
Liam Bailey - Global Head of Research
+44 20 7861 5133
Kate Everett-Allen - International Residential Research
+44 20 7167 2497
PRESS OFFICE
Astrid Etchells - International PR Manager
+44 20 7861 1182
Important Notice
© Knight Frank LLP 2017 – This report is published for general information only and not to be relied upon in any way. Although high standards have been used in the preparation of the information, analysis, views and projections presented in this report, no responsibility or liability whatsoever can be accepted by Knight Frank LLP for any loss or damage resultant from any use of, reliance on or reference to the contents of this document. As a general report, this material does not necessarily represent the view of Knight Frank LLP in relation to particular properties or projects. Reproduction of this report in whole or in part is not allowed without prior written approval of Knight Frank LLP to the form and content within which it appears. Knight Frank LLP is a limited liability partnership registered in England with registered number OC305934. Our registered office is 55 Baker Street, London, W1U 8AN, where you may look at a list of members’ names.