Property Barometer - South African Former "Township" Markets
FORMER “TOWNSHIP” MARKETS
Former Black Township house price growth performance remains marginally ahead of the “Suburbs”, sustaining the “Affordability and delivery challenge"
FORMER “TOWNSHIP” HOUSE PRICE GROWTH SLIGHTLY AHEAD OF “SUBURBS”
The areas formerly classified as “Black Township Areas” under Apartheid Era classifications, outperformed the former White “Suburbs” in terms of house price growth late in 2013, albeit only marginally.
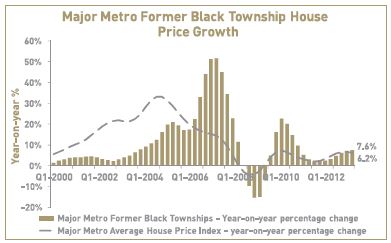
In the 4th quarter of 2013, the FNB Former Black Township House Price Index for the 6 Major Metro regions rose by 7.6% year-on-year. This is slightly higher than the 7.1% revised growth for the previous quarter, and mildly higher than the 6.2% recorded for the entire market in the 6 major metros (Ethekwini, Cape Town, Nelson Mandela Bay, Ekurhuleni, Joburg and Tshwane).
RECENT TOWNSHIP PRICE INFLATION IS NOT EXTREME, BUT CONTINUES TO POSE CHALLENGES
The difference between former Township house price growth and that of the higher priced “Suburban” markets in recent times has been marginal. The 7.6% rate reflects some real price growth, being just above the consumer price inflation rate, and thus a solid market where demand is very well balanced with supply. A portion of the country’s 1st time buyers enter the residential markets via either the established parts of the former “Township” markets or via so-called Affordable Housing Developments, many of which are in or around these Township areas, and a high rate of 1st time buying activity in the past few years has arguably served these markets well.
From the point of view of those already owning homes, capital growth in real terms is normally welcome news.
However, from a point of view of those still wanting to acquire homes, ongoing real price growth caused by relative supply constraints is perhaps less good news at the lower income end of the market.
THE COMBINATION OF BUILDING COSTS AND LOW EMPLOYMENT GROWTH CONSTRAIN NEW HOUSING DELIVERY…
Similar to the Suburban markets, new development activity in the Township markets and their surroundings are somewhat constrained by building costs that haven’t really been declining. And the real price growth in the market is a reflection of a constrained supply side relative to demand growth.
This is less of an issue in higher income markets, but at the low income end, where the aim is to get everyone housed, this is a very significant challenge.
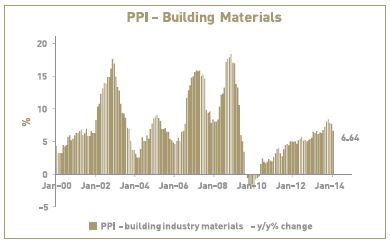
At best, of late, we may be seeing building cost inflation subside somewhat. The year-on-year inflation rate in the Producer Price Index for Building Materials slowed to 6.64% year-on-year in January, from a peak of 8.4% as at October 2013.
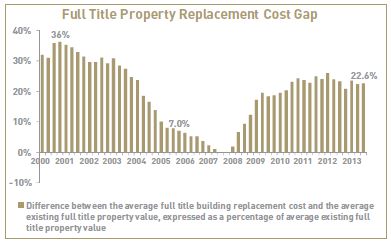
And so, our FNB estimate of the National Full Title Property Replacement Cost Gap, i.e. the percentage by which the average property’s replacement cost exceeded the existing home value, remained at a very significant 22.6% near to the end of 2013.
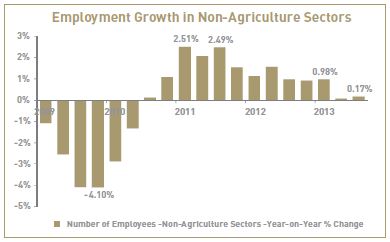
However, not all of the blame can be placed on building costs. The reality is that employment growth is now down to a snails pace, and it is tough to deliver housing to a very significant number of people who don’t earn a reliable income. As at the 3rd quarter of 2013, non-agriculture employment growth was a meager 0.17%.
OUTLOOK
Nevertheless, amongst those that are employed, residential demand relative to supply in the lower income areas such as the former Black Townships remains solid. This is reflected in Major Metro Former Black Township house price growth marginally exceeding that of the so-called former “White Suburban” areas, whose demand-supply balances are themselves “healthy” at present.
As the year progresses, it is believed that Township house price growth will continue to moderately exceed that of the Suburbs, with these markets expected to benefit relative to suburban markets from a greater search for affordability by home buyers, the result of an expected moderate rise in interest rates. However, these markets remain credit and interest ratesensitive, and our expectation that prime rate will rise further to end 2014 at 10% is expected to slow residential demand growth, and thus house price growth across most residential segments.
Therefore, while Township house price growth may well keep its nose ahead of the higher priced suburban markets, it too is expected to remain in single-digit territory in 2014.
HOW HAVE WE PROGRESSED WITH HOUSING DELIVERY?
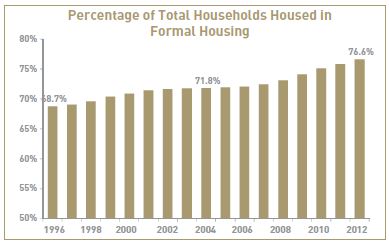
The issue of weak employment growth and building costs constraining the level of new housing delivery is expected to remain. However, this is not expected to stop the gradual long term trend towards a higher portion of the country’s households being housed in formal housing, but merely to restrict the pace. The percentage of households housed in such housing has risen gradually from 68.7% in 1996 to 76.6% by 2012.
*Note: The House Price Indices quoted in this report have been estimated using Deeds data transactions by individuals.
PROPERTY BAROMETER – AREA VALUE BANDS
Former Black Townships outperform, holiday towns recovering but still lagging the metros, and Middle Income areas still appear to be a “sweet spot” by a small margin in the “Former Suburban” areas.
“LOW INCOME” AREAS OUTPERFORM ON PRICE GROWTH
Our 1st Quarter 2014 FNB Area Value Band house price estimates point to “Low Income Area” average price growth exceeding the other 3 higher value area segments. However, it must be said that segment price growth rates still move in a relatively narrow range, with not much to choose between them.
Using Deeds data relating to transactions by individuals, we group areas into 4 “Major Metro Region* Area Value Bands” according to the longer term average prices of these areas. The 4 area value bands are the “Upper Income Area” value band, with a 4th quarter average price of R2.1 million, the “Middle Income Area” value band, with average value of R1.27 million, the “Lower-Middle Income Area” value band, with average value of R811,348, and the “Low Income Area” value band, with average value of R433,369. As at the 1st quarter, the Low Income Area Value Band showed the highest price growth of 7.5%. This is higher than the Middle Income Areas house price inflation rate of 6.7%, the Lower Middle Income Areas with 6.1%, and the Upper Income Areas with 5%.
These relative performances alone don’t provide us with all of the insights, however. The Low Income Area performance is perhaps a “tale of 2 markets”. Many of the areas in this value band fall into the category of “Former Black Townships” (with a significantly lower average value of R295,800), and it is this group of areas that appears to be giving the Low Income Areas as a group their overall higher average price inflation.
The Former Black Township Area segment is still on average the most affordable, and these areas are also arguably still the “preferred location” for many of the so-called Black households, as a portion of any group often prefers to live where its “roots” are. The demand for township property may currently be enhanced by what is still a financially constrained household sector financial situation, implying a search for affordability, while available stock is also perceived to be more constrained here than in the former “White Suburban” areas.
Therefore, in the 1st quarter of 2014, average price growth for the Former Black Township areas of South Africa’s major metro regions was estimated at 10.7% year-on-year, an acceleration from the revised 9.4% for the previous quarter. When considering the relative performances of the area value bands, it is not clear that relative performances are solely driven by affordability though.
FNB Estate Agent Surveys in recent times have suggested that the areas in the average price range not far above R1m were something of a “sweet spot”. They have pointed to a high level of selling in order to upgrade by homeowners in areas below the R1m price mark (Lower Middle Income), and we believe that this upgrading has been a strong source of support for demand in the Middle Income Area value band.
Do the relative price performances suggest the same? To a small degree yes, with Middle Income Areas showing estimated 1st quarter price growth of 6.7% year-on-year, slightly higher than the 6.1% for the Lower Middle Income Area Value Band.
Once again, though, it must be emphasized that the differences in the relative performances of the 4 area value bands are small. Outside of the Major Metros, we have compiled a Holiday Towns Index, using transaction data for towns deemed to be strongly holiday demand driven.
Here, we have recently seen some acceleration in house price growth back into positive territory to the tune of 4.3% in the 1st quarter of 2014. This appears in line with the FNB Estate Agent Survey reporting some moderate rise in holiday property demand, but the Holiday Town Index still lags the 6% 1st quarter price growth rate of the 6 Major Metros, which are driven by what is still far stronger primary residential demand.
This 4.3% Holiday Town price growth rate is the highest growth rate since the 1st quarter of 2008, after what has been a tough period for these regions.
CONCLUSION
In short, therefore, the relative performances of key price segments of the major metro residential markets continue to move in a relatively narrow range. When one specially splits out the Former Black Townships, which are on average the most affordable areas of the residential market, we estimate that they have had the fastest price growth, with affordability still a key priority for many households.
However, from our FNB Estate Agent Surveys as well as from the average house price growth estimates, the Middle Income areas, with average home values not far above R1m, also appear to be a relative “sweet spot”, albeit by a small margin.
Finally, we have compared Holiday Town average price growth performance with that of the Major Metros, and while these towns have shown some recovery, they still lag the primary residence driven metros in terms of price growth. This is to be expected, given the non-essential nature of holiday property buying, and given the still financially constrained household sector.
*Major Metros – Tshwane, City of Joburg, Ekurhuleni, Ethekwini, Cape Town and Nelson Mandela Bay
Source: John Loos (FNB)