SA Commercial Property - Signs of economic weakness and rising vacancies suggest a flat commercial property year in 2012
COMMERCIAL PROPERTY PROSPECTS FOR 2012
SIGNS OF ECONOMIC WEAKNESS AND RISING VACANCIES SUGGEST A FLAT COMMERCIAL PROPERTY YEAR IN 2012
Recently, FNB’s All Commercial Property Performance Indices have started to point to weakening performance ahead. The 3rd quarter did see some rise in the All Commercial Property average price growth rate. However, the same quarter also saw a very slight rise in the average capitalisation rate, but more significantly the FNB All Commercial Vacancy Rate Index had been rising noticeably for 2 consecutive quarter, from an index level of 93.6 as at the 1st quarter of 2011 to 97.7 by the 3rd quarter, the highest vacancy index reading since the 4th quarter of 2005.
Should this rising vacancy rate trend continue, it could be expected to dampen rental income prospects and lead to a more noticeable rise in capitalisation rates, which in turn could be expected to exert downward pressure on price growth.
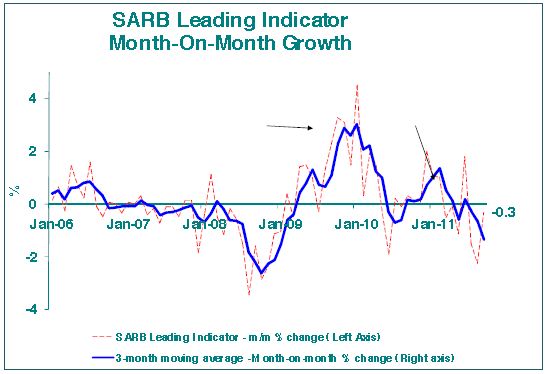
Examining global leading business cycle indicators recently, along with broadly weakening industrial production, 2012 looks set to be a weaker global economic growth year than 2011. The SARB Leading Business Cycle Indicator would suggest this to be the case domestically too. On a month-on-month basis, the Indicator has been in decline for the past 3 months.
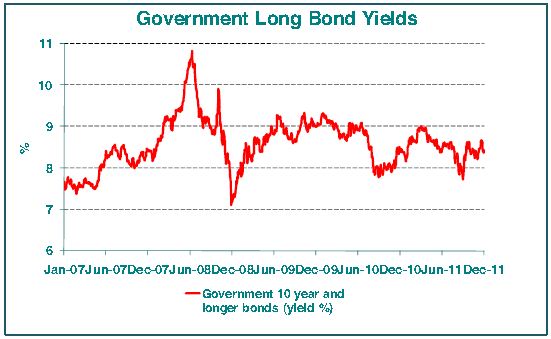
Not only would a weakening economy be expected to exert upward pressure on commercial vacancies, but concerns regarding global economic prospects also tend to exert upward pressure on long bond yields of emerging economies such as South Africa, as investors flee for (somewhat dubious) “safe havens” in the developed world. Indeed, SA Government long bong yields are currently off their lows of early-September, partly reflective of growing concerns regarding global economic prospects and the impact on the likes of SA. This, along with higher vacancies, leads us to anticipate an increase in capitalisation rates in 2012, which in turn could exert downward pressure on real commercial property values.
We believe that a further sign of possible looming commercial property price weakness is the slowing in year-on-year price growth in the residential market in recent months. While commercial property is not believed to be as over-priced as residential, and its yields are estimated to be higher than residential, it is subject to the same interest rate and economic trends as residential, and thus generally tracks the direction of residential price growth trends with something of a lag.
Therefore, economic indications are that commercial property, too, could be in for a challenging year in 2012. Indeed, after a mini-recovery in 2010, the Investment Property Databank (IPD) has already reported declining commercial property returns in the 1st half of 2011. During this expected period of weakness, if one could generalise, it would appear that prime properties/ areas look set to hold up better than the “less illustrious” ones. Already, the IPD has reported a significantly more rapid rise in office vacancies of Central Business Districts (18.1% in H1 of 2011) compared to de-centralised nodes (10.4%). Similarly, in the case of retail, it has been the smaller community (8.1%) and neighbourhood (10.2%) shopping centres that have seen more noticeable rises in vacancy rates, while regional (3.2%) and super-regional (2.4%) shopping centres remained at far lower vacancy rates in the 1st half of this year.
NB HEADLINE COMMERCIAL PROPERTY TRENDS – SLOWER ECONOMY, TRANSLATING INTO RISING VACANCIES AND WEAK RENTALS, MAY START TO EXERT UPWARD PRESSURE ON CAPITALISATION RATES
FNB Commercial Property Finance data relates predominantly to the smaller owner-occupied commercial segment with properties included below R50m in value. In the 3rd quarter of 2011, our FNB All Commercial (i.e. retail, industrial and office included) Vacancy Rate Index started to rise noticeably again, after finding some stability through 2010 and early-2011.
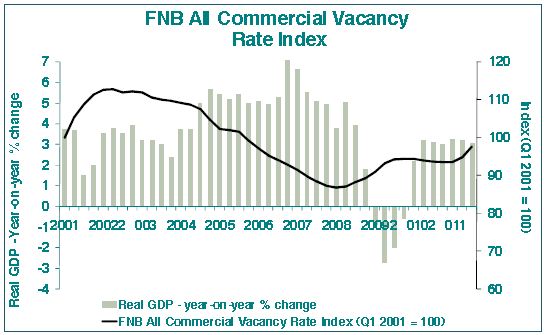
This renewed upward pressure on vacancies coincides with renewed pressure on the domestic economy. Following the 2008/9 economic recession, which had caused the vacancy rate index to rise significantly, we witnessed a reasonable recovery in economic growth, as a result of a global economic recovery of sorts along with major Reserve Bank (SARB) interest rate cuts from late-2008. However, in the 1st half of 2011 we have begun to see economic growth starting to slow, due to a lack of local interest rate cutting this year, as well as due to renewed global economic pressure.
Heading towards 2012, the early-signs are that we may see further upward pressure on vacancies in the commercial property sector. At least, this is what the SARB Leading Business Cycle Indicator would suggest. On a month-on-month basis, the Indicator has been in decline for the past 3 months, and although the monthly figures are volatile, the 3-month moving average value also continued to show downward acceleration in September.
Not surprisingly, in recent months, the SARB has indicated that one of the key negative factors in the SARB Leading Indicator has been weakness in the Leading Indicator of SA’s major trading partner countries, indicating that global economic weakness is set to have a significant impact on our own economy.
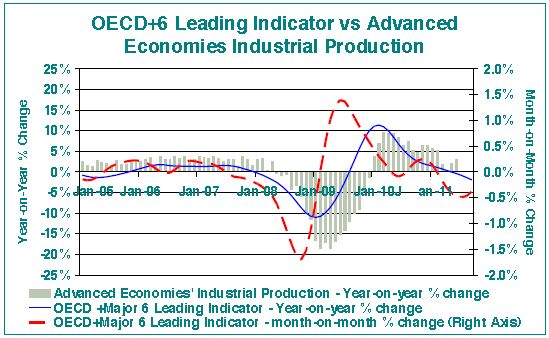
Currently, the Eurozone economy has been a major concern as contagion from the debt crises of certain of its member states threatens to spread. However, the risks don’t stop there, with the highly-indebted United States also vulnerable at present. The world’s biggest economy is also the major “oil guzzler”, and oil prices traditionally tend to cause the US economy to contract. Oil prices have remained high ever since the surge earlier in 2011 as political turmoil in the Middle East broke out, with Brent Crude at $109/barrel at time of writing. US consumer confidence has remained weak in recent months, despite some improvement. So, unsurprisingly, we have seen industrial production in the advanced economies showing significantly slower growth in 2011 compared to 2010.
Key global leading indicators (which generally lead industrial production trends) suggest further slowing in early-2012, which could exert pressure on the SA economy via its exports, and this in turn threatens to raise the All Commercial vacancy rate further.
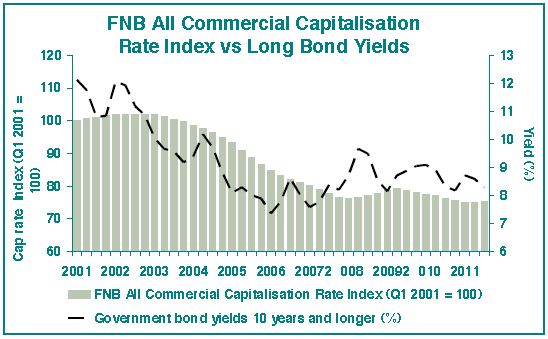
A weaker global economy tends to put pressure on Emerging Market bond yields, and on their currencies. Indeed, from a 7.72% low on 6 September 2011, yields on government bonds of 10 years and longer were hovering around higher levels of 8.37% by 9 December 2011, reflecting increased investor concern of late over the well-being of the global economy and its impact on emerging markets.
The combined effect of the expected weakening in the economy as we head towards 2012, and its possible dual effect of raising commercial property vacancy rates as well as long bond yields, could be expected to exert upward pressure on commercial property capitalisation rates (Cap rates) in 2012.
To date, the FNB All Commercial Cap Rate Index (Q1 2001=100) has started to show only a marginal rise in the 3rd quarter, from an index value of 74.8 in the previous quarter to 75.2, following a mildly declining trend dating back to mid-2009.
Given what has been said about rising vacancies and bond yields above, we would expect further increase in the Cap rate Index in the coming quarters.
COMMERCIAL PROPERTY DOESN’T APPEAR AS OVERPRICED AS RESIDENTIAL, BUT RESIDENTIAL PRICE TRENDS MAY BE GOOD LEADING INDICATOR FOR COMMERCIAL PROPERTY PRICE TREND DIRECTION.
While some would contend that the overall performance “level” of residential property currently differs significantly from that of commercial property, the direction of the respective segment’s trends probably do not, with similar economic factors driving both.
Residential rental and yield data is hard to come by, one gets the impression that residential yields are generally lower than in the commercial property segment. This would make sense, as we are of the opinion that a strong culture of home ownership in SA (with yields not being a major consideration), along with a group of less sophisticated investors prepared to pay a premium for a residential property which they perceive as easier to understand and manage (compared to a commercial property), has driven residential yields to lower levels.
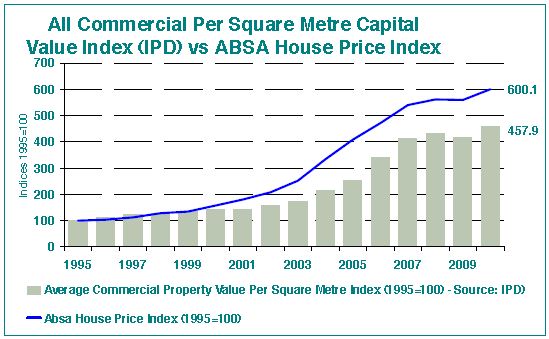
The result was that, although both residential and commercial property both had spectacular price booms over the past decade or more, the residential boom was somewhat more spectacular. From 1995 to 2010, the average house price (Absa Index) rose cumulatively by 500.1%, while the IPD’s All Commercial per square metre property value rose by a lesser 357.9% over the same period. This translated into less yield compression for commercial property than in the case of residential property.
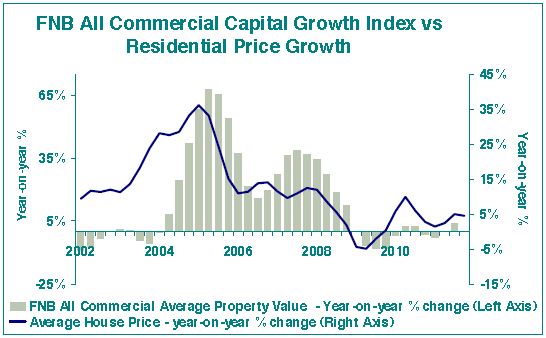
Nevertheless, the directions of price growth trends have tracked each other fairly well over the past decade, with residential generally leading commercial property trends.
This is borne out by examining the FNB All Commercial Capital Growth Index in comparison to the FNB House Price Index. The FNB All Commercial Capital Growth Index is compiled on a similar basis to he FNB House Price Index, i.e. it reflects the average value of properties and not the per square metre value. fter a commercial price growth boom from 2004 to 2008 which resembled the shape of the residential price boom (only starting a little later than the residential boom), the All Commercial Index, like the residential price index, showed year-on-year price decline from early-2009, followed by a mini-recovery in 2010, a dip late last year and early in 2011, and a very slight return to positive growth by the 3rd quarter of this year. In recent years, the growth direction of the 2 indices has been almost the same, with the Commercial Price Index lagging by about 1 quarter.
Should this correlation in direction of price growth between the two continue to hold, a recent resumption of slowing in house price growth (3.2% year-on-year in November, down from 4% in October), would point to commercial property value growth about to follow suit
This expectation would make sense from the point of view of all that we have mentioned above, i.e. a weakening economy as 2012 approaches, translating into the start of further rise in vacancy rates along with long bond yields rising, which in turn should imply the start of a rising trend in cap rates. Higher cap rates could be expected to exert downward pressure in commercial property values in 2012, should our economic expectations prove correct.
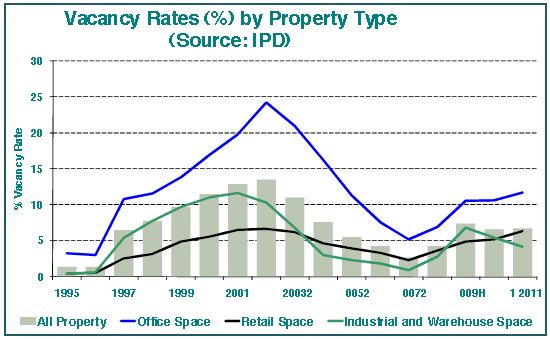
SEGMENT DATA POINTS TO OFFICE SPACE BEING MOST OVERSUPPLIED
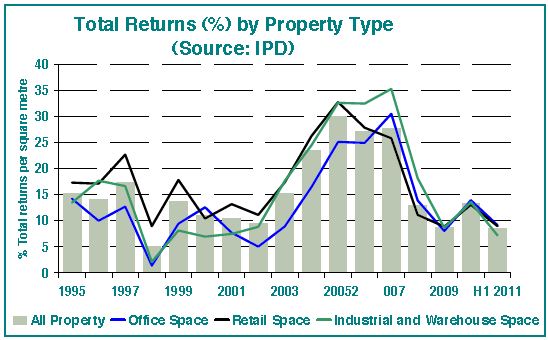
Investment Property Databank (IPD) data for the 1st half of 2011 had already begun to point to a decline in total returns (income and capital growth) in all 3 of the major commercial property sub-segments, in very similar style to the residential market following the mini-recovery of 2010. Annualised returns for Office Space in the 1st half of 2011 measured 9.2%, retail 9% and industrial and warehouse space 7.2%.
Similar to the renewed upward trend in the FNB All Commercial Vacancy Rate Index, the IPD All Commercial Vacancy Rate also started to resume its rise in the 1st half of 2011, from a 6.6% average for 2010 to 6.8% average for the 1st half of this year. This was due to increases in both office vacancies and retail space vacancies, while some further decline in industrial and warehouse vacancies partly offset these.
CONCLUSION – A WEAK ECONOMY IN 2012 LOOKS SET TO RAISE VACANCIES FURTHER AND KEEP RETURNS UNDER PRESSURE
Examining global leading business cycle indicators, along with broadly weakening industrial production, 2012 looks set to be a weaker economic growth year than 2011. Already, in recent months, we have seen our FNB Residential House Price Index growth rate slowing once more, which we believe to be a reasonably good leading indicator of commercial property capital growth trends. In addition, the 3rd quarter saw a noticeable rise in the FNB All Commercial Vacancy Rate Index as real economic growth had begun to slow, while the IPD data had also begun to show rising commercial vacancies in the 1st half of 2011.
While the FNB capitalisation rate index has only risen very slightly as at the 3rd quarter of 2011, after a previously declining trend, rising vacancies along with long bond yields being off their 2011 best levels of a few months ago, leads us to anticipate an increase in capitalisation rates in 2012, which in turn would exert downward pressure on real commercial property values During this period, if one could generalise, it would appear that prime properties and areas look set to hold up better than the “less illustrious”. Already, the IPD has reported a significantly more rapid rise in office vacancies of Central Business Districts (18.1% in H1 of 2011) compared to de-centralised nodes (10.4%). Similarly, in the case of retail, it has been the smaller community (8.1%) and neighbourhood (10.2%) shopping centres that have seen more noticeable rises in vacancy rates, while regional (3.2%) and super-regional (2.4%) shopping centres remained at far lower vacancy rates in the 1st half of this year.
Courtesy: The EAAB - Estate Agency Affairs Board

“Redressing the Past, Building the Future and Guiding the Real Estate Business towards Professionalism”